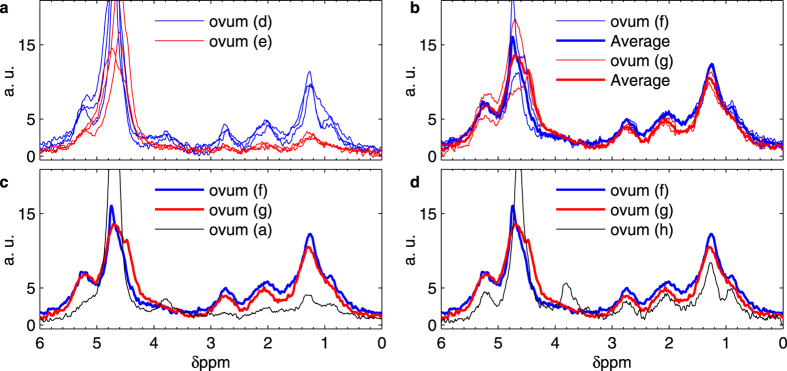
Figure 3. Reproducibility study of Richtersius coronifer (Rc) spectra.
(a) Measurements of two ova, ovum (d) and ovum (e) as indicated in Fig. 2b. Each ovum was arbitrarily repositioned three times within the respective spent gels. Each spectrum results from 12 hours of averaging. (b) Measurements of two ova, ovum (f) and ovum (g) as indicated in Fig. 2b. Each ovum was arbitrarily repositioned twice within fresh gels. Each spectrum results from 12 hours of averaging. (c) Comparison of averaged spectra of ova (f) and (g) with spectrum of ovum (a) as indicated in Fig. 2b. (d) Comparison of averaged spectra of ova (f) and (g) with spectrum of ovum (h) as indicated in Fig. 2b.

