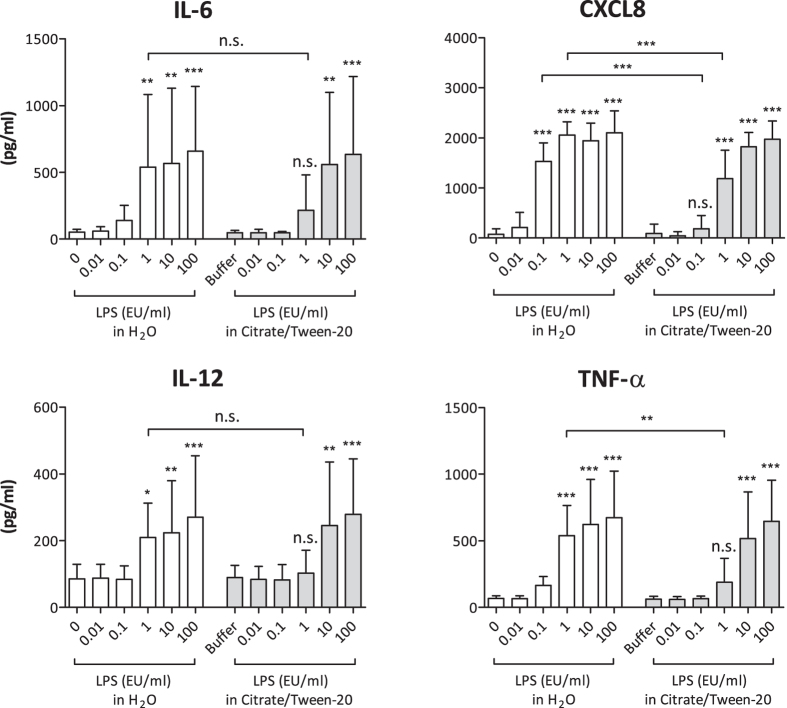
Figure 5. Cytokine expression of human monocytes stimulated with masked and non-masked LPS.
1 × 10⁵ monocytes were stimulated as indicated. After 24 h of incubation, supernatants were harvested and analysed via ELISA. Mean and SD of 8 independent experiments are shown. For statistical analysis within each group, ANOVA with a Dunnett’s post-test was performed. For comparisons between different groups, ANOVA with a Tukey post-test was performed. *p ≤ 0.05; **p ≤ 0.01; ***p ≤ 0.001; n.s. not significant.

