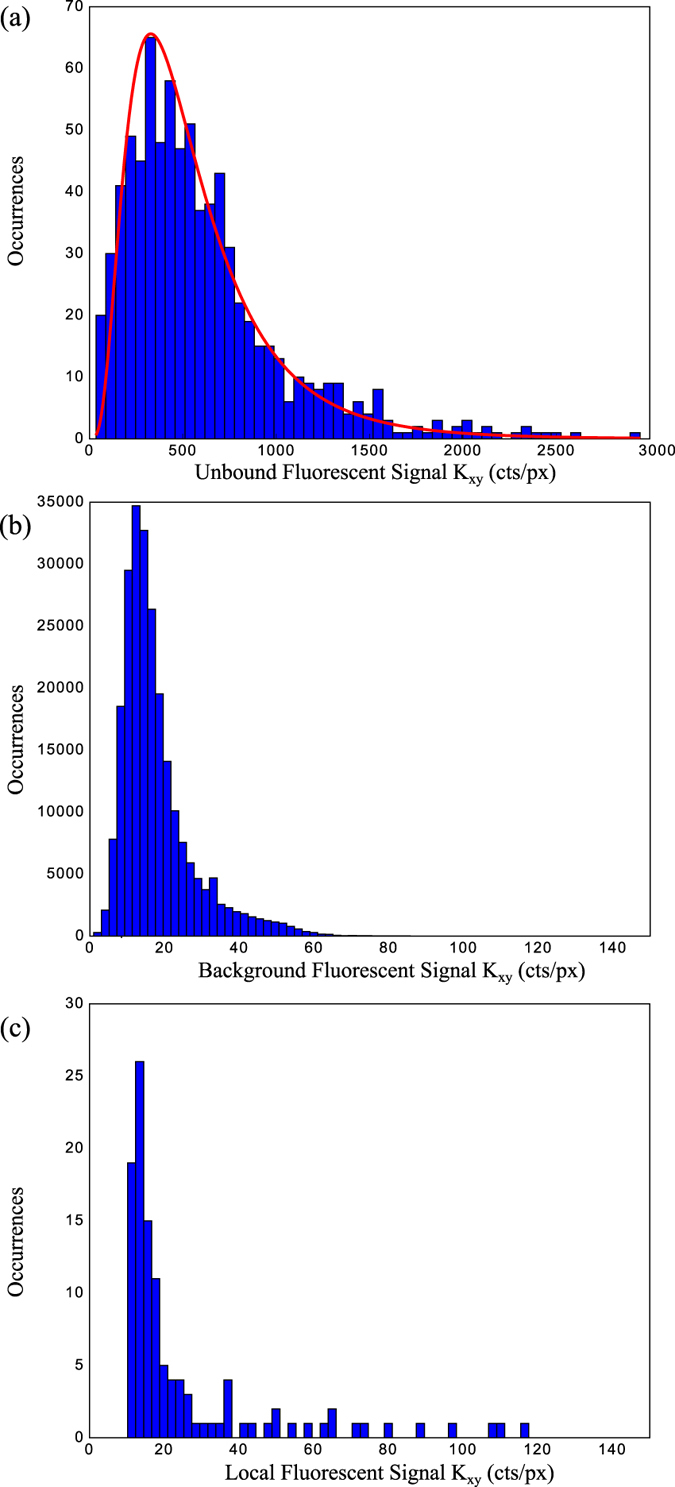
Figure 5.

(a) A histogram of the fluorescent signals independent of in-plane dipole orientation (Kxy) not associated with scattering signatures (unbound). (b) The distribution in fluorescent background counts further than 0.17 μm away from any identified scattering or fluorescent signatures. (c) The mean fluorescence localised within 0.17 μm of each scattering signature.
