Figure 3.

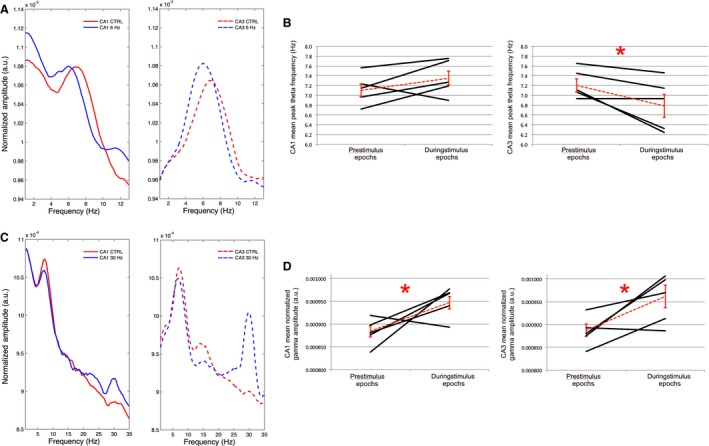
: EEG spectral data prior to and during multiple blue light stimulations at 6 Hz or 30 Hz: (A) Averaged amplitude spectrum for the five control epochs (red) and 5 MS stimulation epochs (blue) in CA1 (solid lines) and CA3 (dashed lines) for an individual rat. The average spectrum for this rat indicates frequency shifts at peak‐theta amplitude from approximately 7 Hz during prestimulation epochs to 6 Hz during 6‐Hz stimulation epochs in both CA1 and CA3. (B) Average and standard error of the mean peak‐theta frequency across rats (red dashed lines) as well as mean peak‐theta frequency for each individual rat (black lines; N = 5) during the five control and 6‐Hz stimulation epochs in CA1 (left) and CA3 (right). While the general trend across rats is for a nonsignificant increase in mean peak‐theta frequency in CA1 there is a significant decrease in mean peak‐theta frequency in CA3 where 2/5 animals demonstrate entrainment of theta frequency by MS stimulation at 6 Hz. (C) As in A, during averaged epochs before and during 30‐Hz blue light stimulation. Increases in the average signal amplitude are evident at 30 Hz during 30 Hz blue light stimulation in comparison to the average signal amplitude in this range in the prestimulation epochs. (D) Average and standard error of the mean gamma amplitude (28–32 Hz) across rats (red dashed lines) as well as mean gamma amplitude for each individual rat (black lines; N = 5) during the five control and 30‐Hz stimulation epochs in CA1 (left) and CA3 (right). The 30‐Hz blue light stimulation robustly alters signals in the 28–32 Hz bandwidths. (* = statistical significance).
