Figure 6.

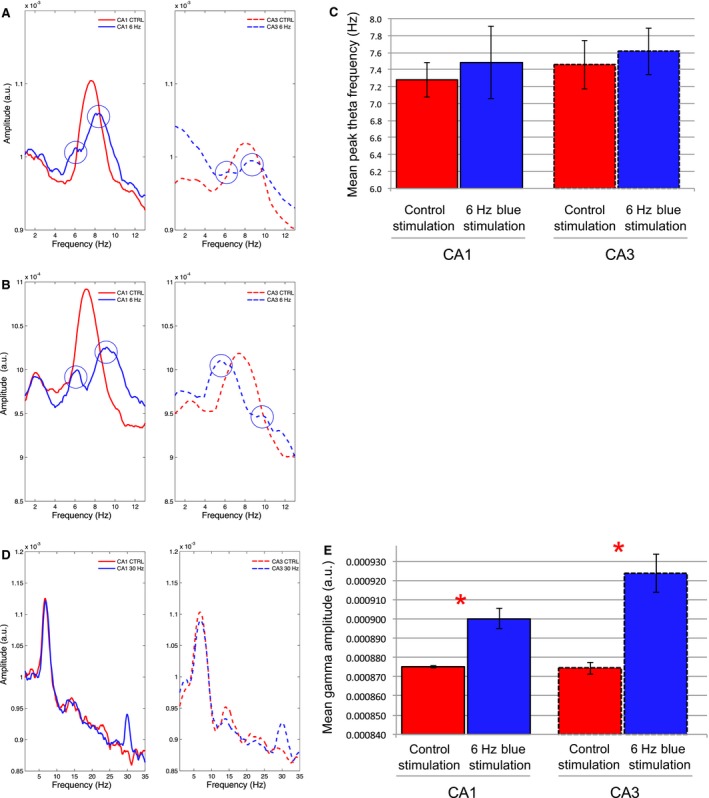
: Examples of the mean EEG spectrums during control‐yellow and blue light stimulations at 6 Hz or 30 Hz over the course of the entire recording session in which the rat explored novel environments (N = 4): (A‐B) The signal spectrums during 6‐Hz blue light MS stimulation (blue lines) from 2 animals (top and bottom) indicate a bisection of peak‐theta amplitude in comparison to 6‐Hz control stimulation (red lines) in both CA1 (solid lines at left) and CA3 (dashed lines at right). Two modes appear in the theta spectrum, one at approximately 6 Hz and the other at approximately 9–10 Hz; (C) The lack of a significant mean peak theta frequency effect across rats (N = 4) following 6‐Hz stimulation may be explained by the bisection of theta seen in A and B and the corresponding variability in theta frequency; (D) As in A–B, signal amplitude spectrums for an individual rat are compared between 30‐Hz blue light stimulation and 30 Hz yellow control light stimulation in the MS for both CA1 and CA3. The 30‐Hz stimulation again clearly increases the amplitude of the EEG signal in the 30 Hz range in both CA1 and CA3. (E) The mean and standard error of gamma amplitude (28–32 Hz) across rats. Significant increases in signal amplitude at 28–32 Hz were again found in correspondence to 30‐Hz blue light stimulation. (* = statistical significance).
