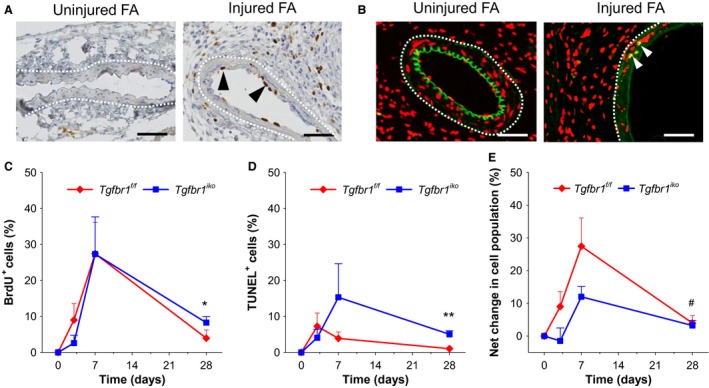
Figure 3.

Tgfbr1 iko accelerates myointimal cell proliferation and apoptosis. Specificity of the anti‐BrdU (A) and TUNEL (B) labeling assays evaluated on Tgfbr1 f/f femoral arteries (FAs) with the indicated manipulation on d7. Black arrowheads: BrdU+ cells (brown); white arrowheads: TUNEL + cells (yellow); white dash lines: EEL; blue and red: nuclear counterstain; and green: autofluorescence. Scale bars, 50 μm. Note that BrdU+ cells and TUNEL + cells were detected only in the injured FAs. Quantitative analysis of the BrdU+ cells (C), TUNEL + cells (D), and the net change of cell population (E) in the myointimal layer (n = 5–7 per group of either genotype at each time point). Time: P < 0.001 (two‐way ANOVA) for all three measured variables. *P = 0.037 (C), **P = 0.003 (D), and # P = 0.834 (E) by t‐tests.
