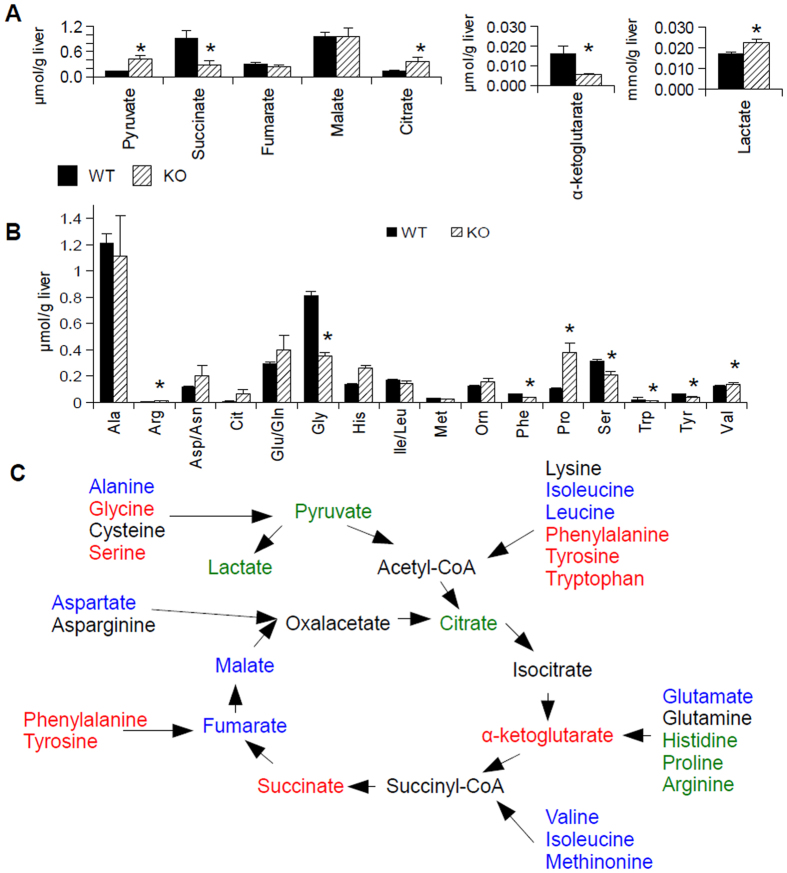
Figure 2. The tri-carboxylic acid cycle function is impaired in G6PC KO mice.
(A) Organic acid analysis in the livers G6PC KO mice (KO, n = 6) compared to wild-type (WT, n = 10) mice. (B) Analysis of amino acid levels in the same samples. (C) Schematic of the changes of the species in the TCA cycle. Species in green were increased in G6PC KO mouse livers relative to WT livers, while those in red were decreased. Species in blue showed no significant change between groups, while those in black were not directly measured. For all parts, error bars represent SEM, *represents p < 0.05.

