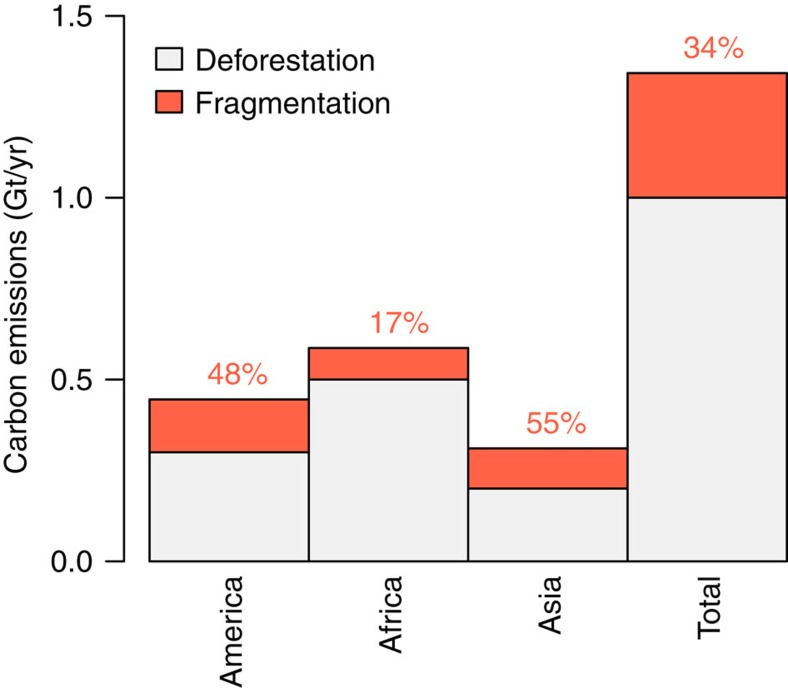
Figure 4. Annual carbon emissions from tropical forests.
Annual carbon emissions from tropical deforestation2 (grey bars) and additional emissions from tropical forest edges due to fragmentation from this study (orange bars). The percentages represent the fraction of tropical fragmentation carbon emissions and tropical deforestation carbon emissions.

