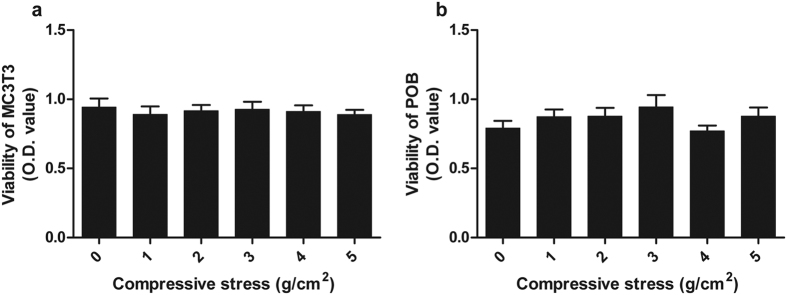
Figure 2. Viability of cells exposed to compressive stress.
The viability of MC3T3-E1 cells (a) and POBs (b) was not inhibited by compressive stress ranging from 0 g/cm2 to 5 g/cm2. Data are displayed as the mean ± SD from one representative of three independent experiments (n = 5 per group). “p” denotes the significance level compared with the group exposed to 0 g/cm2 (control). *p < 0.05.

