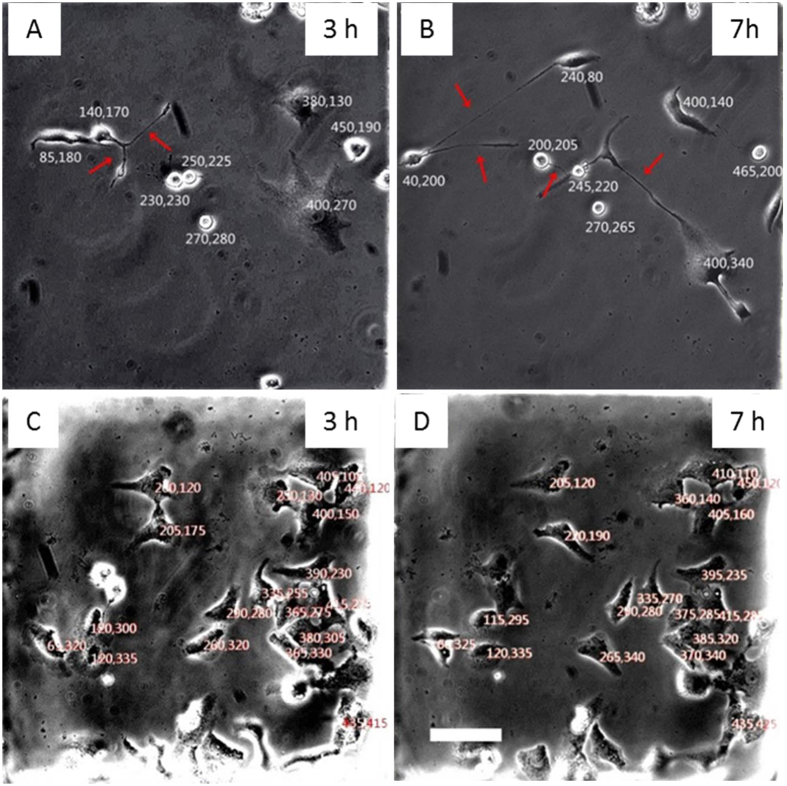
Figure 7. Relative coordinates for labeling cell location.
(A) and (B) showed cells infected by VACV for 3 hours and 7 hours, respectively. (C) and (D) showed normal cells at 3 hour and 7 hour after the observation begins. Each cell was given a relative coordinate, so cell migration distance was calculated by measuring the variation of coordinates. Scale bar: 100 μm.

