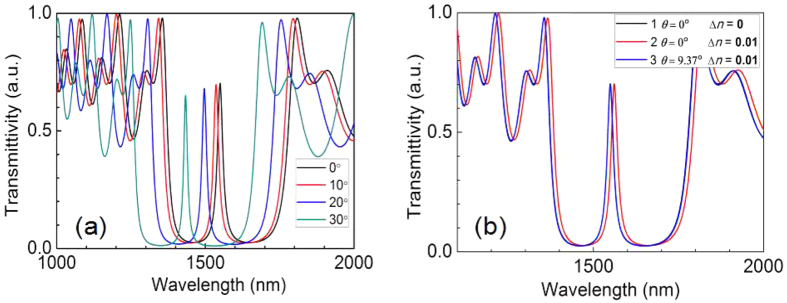
Figure 3. Transmission spectra for various angles.
(a) PSM transmission spectra of for various incident angles. (b) Curve 1 represents the PSM transmission spectrum of vertical incidence (θ = 0°); curve 2 represents the occurrence in the PSM device of a biological reaction that caused the refractive index to increase to Δn = 0.01, identical to a PSM transmission spectrum with vertical incidence (θ = 0°); curve 3 represents the PSM transmission spectrum after a certain rotary angle of incident light.

