
Figure 5. Simulation curves of  and its contributing functions,
  and
and  , in a log plot for the magnetic-field axis.
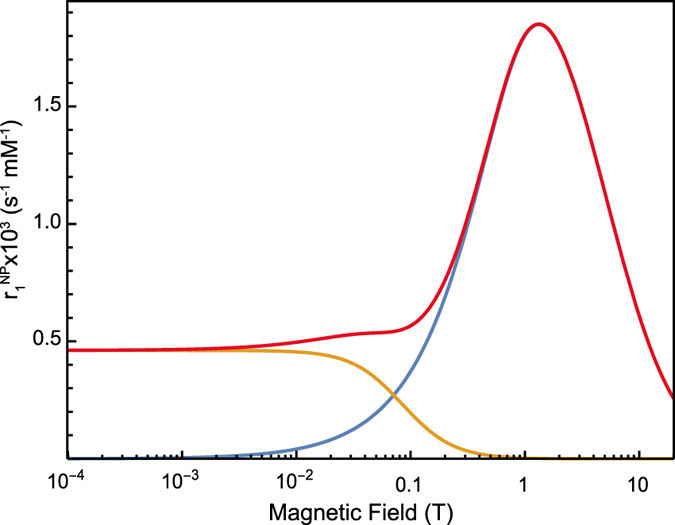
The parameter values we used were: S = 4000, d = 2.2 nm, τ = 14 ns, R1e = 10 ns−1, R2e = 2 ns−1.  is shown in red,
  is shown in blue and displays a high-field dependency in the field range above 0.1 T. The field dependency of
  (orange line) occurs in the field range of 0.01 T to 1 T. For magnetic fields above 1 T,
  becomes the dominant contribution for the nonlinear curve of
  .
.