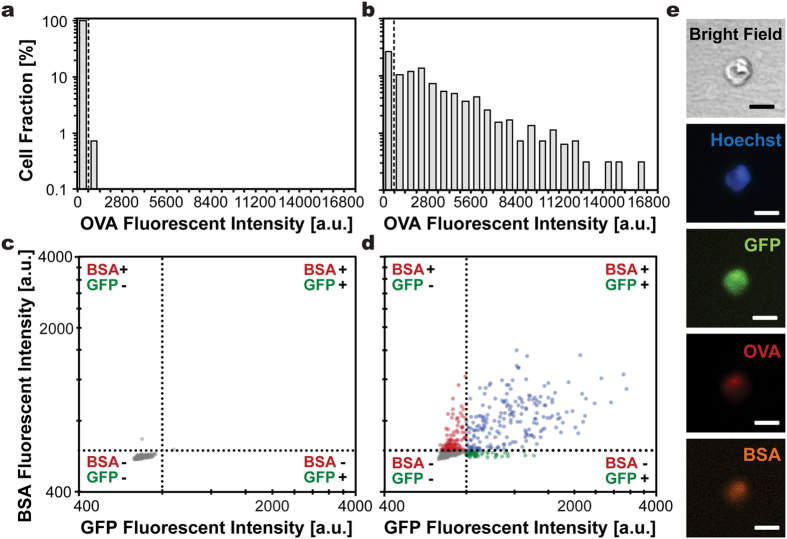
Figure 4. Multiple proteins, including GFP, OVA conjugated with Alexa 555, and BSA conjugated with Alexa 647 were sequentially delivery into HEK293 cells.
The histograms illustrate OVA fluorescent intensity exhibited by cells incubated in OVA for 1 min (a) without or (b) with electroporation. Dashed lines indicate the intensity thresholds above which successful delivery of OVA was determined (ThresholdOVA = 700). The cell populations found above the threshold were 0.7% and 73.2% for those processed without or with electroporation, respectively. Cells sequentially incubated in OVA, BSA and GFP (c) without electroporation or (d) with electroporation exhibited distinctively different fluorescent signals. The fluorescent intensity maps were constructed from (c) the same cell population as in (a) with 99.3% of the population showing intensities below thresholds, and (d) cells with successful OVA delivery (population found above the threshold indicated in (b)). The population was divided into 4 subpopulations with circles, respectively, representing cells displaying signals from all three proteins (27%, blue), BSA and OVA (16%, red), GFP and OVA (9%, green), and OVA only (48%, grey). The order of injected molecules was randomized. (n = 272, 963, 705 cells for (a,c),(b) and (d), respectively). (e) Representative microscopic images illustrate the successful delivery of all three proteins into an identical cell. Scale bars represent 20 μm.

