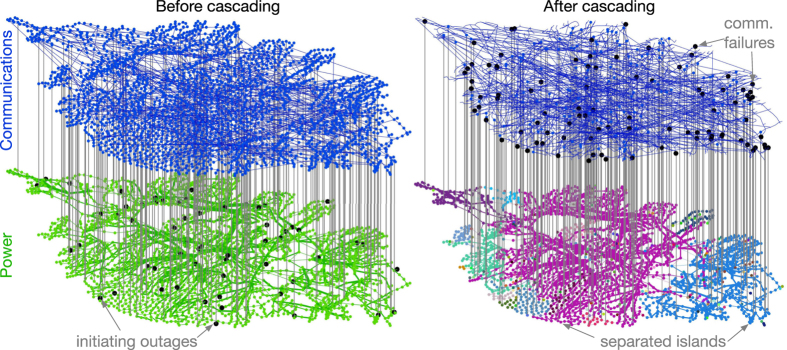
Figure 5. The coupled power-communications model, applied to the Polish power system test case.
The left panel shows the topology of the power and communications networks, along with the initiating node (bus) outages and the internetwork links. The right panel shows the locations of line outages that subsequently occurred in the “Intermediate” Smart Grid model. Colors in the power network on the right show the separation of the grid into nonconnected components as a result of cascading.

