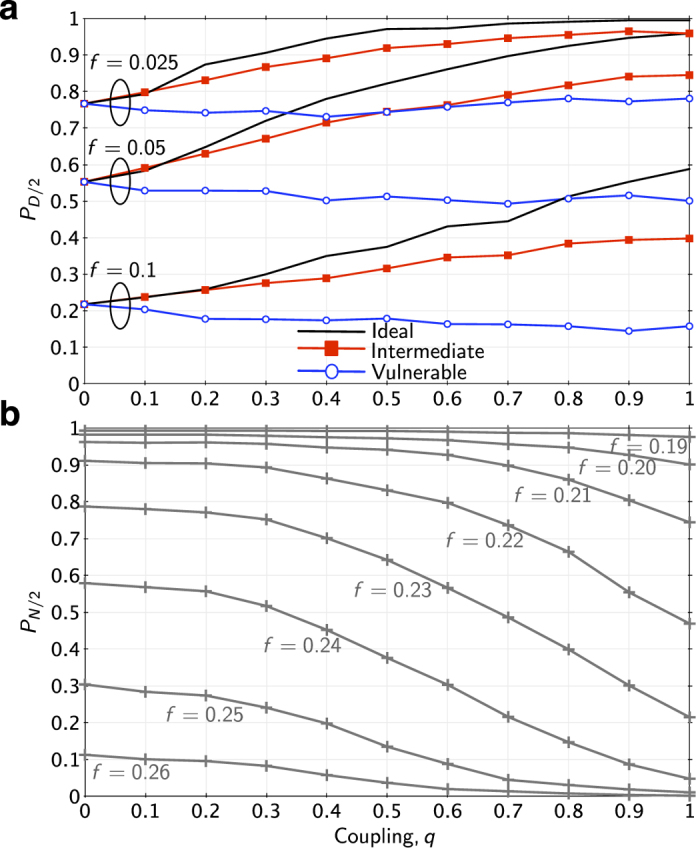
Figure 6. Robustness of the Polish network to random failures, with varying levels of coupling, q.

Panel (a) shows results from four different models of cascading in power grids, three of which are coupled to communications systems, after 5% of nodes initially failed (f = 0.05). In this case, we measured robustness with the probability that at least half of the original demand is served at the conclusion of the cascade. Panel (b) reports analogous results from the Coupled Topological model, for several different failure sizes, with robustness measured as in Fig. 4.
