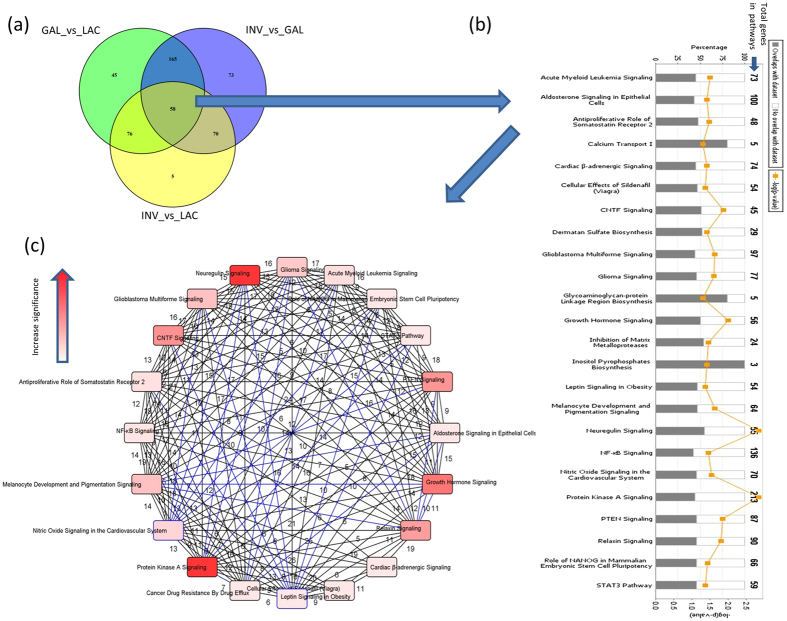
Figure 5.
Enrichment results of miRNAs dynamically differentially expressed throughout the bovine lactation curve. (a) The Venn diagram indicates the number of dynamic miRNAs; (b) pathways enriched for target genes of dynamic miRNAs; and (c) circular overlap of common genes among significantly enriched pathways (outer squares, more intense red colour indicates higher degree of significance) for dynamic miRNA target genes. Numbers indicate the number of common genes between two pathways. LAC: Lactogenesis; GAL: Galactopoiesis and INV: Involution.

