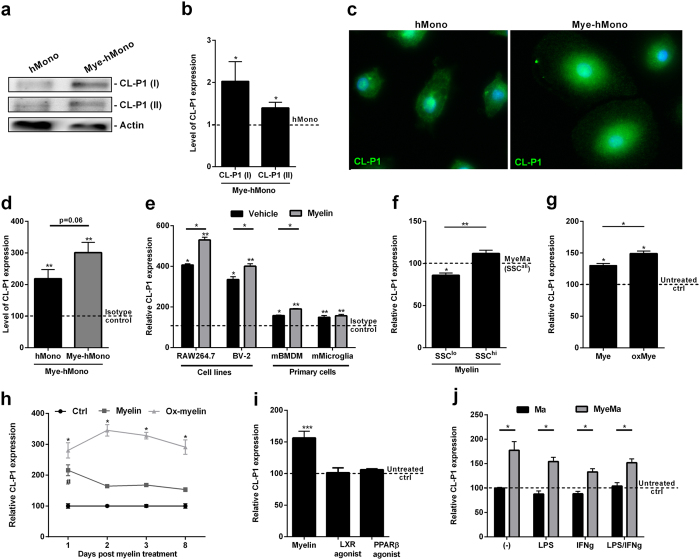
Figure 1. Myelin uptake increases the surface expression of CL-P1 on myeloid cells.
(a,b) Human monocytes (hMono, n = 5), were cultured with or without 100 μg/ml myelin for 24 h. Western blot analysis was used to define CL-P1 expression. Two antibodies were used to define CL-P1 expression. Western blots are displayed in cropped format. (c) Immunohistochemistry (CL-P1, Novus Biologicals) was used to define the expression of CL-P1 by human monocytes cultured with or without 100 μg/ml myelin for 24 h. (d) Human monocytes (n = 7) were cultured with or without 100 μg/ml myelin for 24 h. CL-P1 expression was determined with flow cytometry (CL-P1, R&D). Dotted line represents untreated cells stained with an isotype antibody. (e) RAW264.7 (n = 4), BV-2 (n = 4), mouse BMDMs (n = 4), and mouse microglia (n = 7), were cultured with or without 100 μg/ml myelin for 24 h. CL-P1 expression was determined with flow cytometry (CL-P1, R&D). Dotted line represents untreated cells stained with an isotype control antibody. (f) Mouse BMDMs cultured with 100 μg/ml myelin for 24 h. CL-P1 expression was determined in high granular (SSChi), low granular (SSClo), and all cells (SSCall) using flow cytometry. Dotted line represents myelin-treated cells stained with the CL-P1 antibody (n = 4). (g) RAW264.7 cells were exposed to 100 μg/ml unmodified and CU2-oxidized myelin for 24 h, after which CL-P1 expression was determined. Dotted line represents untreated cells stained with the CL-P1 antibody (n = 4). (h) RAW264.7 cells were cultured with 100 μg/ml unmodified or CU2-oxidized myelin for 1,2,3, and 8 days (n = 3). CL-P1 expression was determined by using flow cytometry. (i) RAW264.7 cells were cultured with a T0901317 (LXR agonist), GW501516 (PPARβ/δ agonist), or 100 μg/ml myelin for 24 h. CL-P1 expression was determined with flow cytometry. Dotted line represents untreated cells stained with the CL-P1 antibody (n = 6). (j) Untreated or myelin treated RAW264.7 cells were exposed to 500 U/ml IFNγ, 100 ng/ml LPS, a combination IFNγ and LPS, or left untreated (n = 4). CL-P1 expression was determined using flow cytometry. Dotted line represents untreated cells stained with the CL-P1 antibody. Data are presented as mean ± SEM. *p < 0.05, **p < 0.01, ***p < 0.001.

