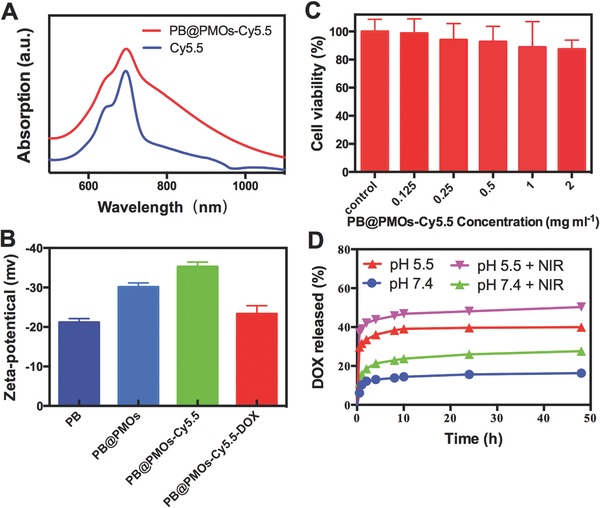
Figure 3.

A) UV–vis absorbance spectra of near‐infrared fluorescent dye Cy5.5 and the PB@PMOs‐Cy5.5. B) Zeta potentials of the PB, PB@PMOs, PB@PMOs‐Cy5.5, and PB@PMOs‐Cy5.5‐DOX. C) Relative viability of MDA‐MB‐231 cells incubated with different concentrations of PB@PMOs‐Cy5.5 for 24 h. D) DOX release curves of the PB@PMOs‐Cy5.5‐DOX at pH 7.4 and 5.5 with or without NIR.
