
Figure 1.
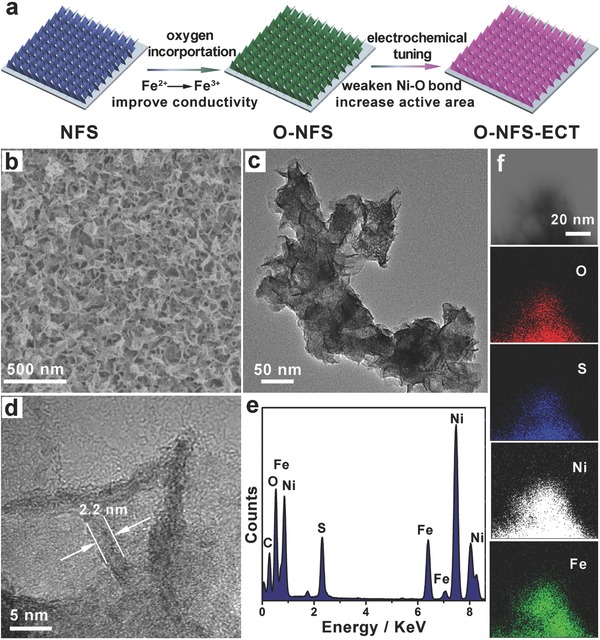
a) Schematic illustration of the preparation of O‐NFS ultrathin nanosheets. b) Representative SEM image, c) TEM image, d) HRTEM image, e) EDS spectrum, and f) STEM‐EDS mapping images of the O‐NFS ultrathin nanosheets.
Official websites use .gov
A
.gov website belongs to an official
government organization in the United States.
Secure .gov websites use HTTPS
A lock (
) or https:// means you've safely
connected to the .gov website. Share sensitive
information only on official, secure websites.
a) Schematic illustration of the preparation of O‐NFS ultrathin nanosheets. b) Representative SEM image, c) TEM image, d) HRTEM image, e) EDS spectrum, and f) STEM‐EDS mapping images of the O‐NFS ultrathin nanosheets.