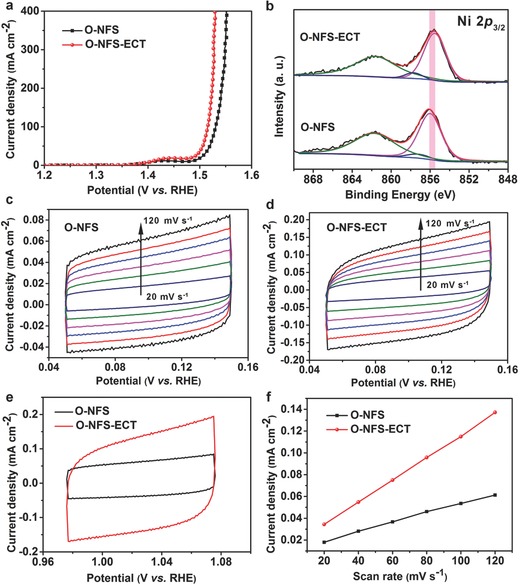
Figure 4.

a) LSV curves of O‐NFS and O‐NFS‐ECT. b) Ni 2p XPS spectra of O‐NFS and O‐NFS‐ECT ultrathin nanosheets. Cyclic voltammetry (CV) curves of c) O‐NFS and d) O‐NFS‐ECT ultrathin nanosheets measured at different scan rates from 20 to 120 mV s−1. e) CVs of O‐NFS and O‐NFS‐ECT ultrathin nanosheets at a scan rate of 120 mV s−1. f) Plots of the current density at 1.026 V vs scan rate for O‐NFS and O‐NFS‐ECT ultrathin nanosheets.
