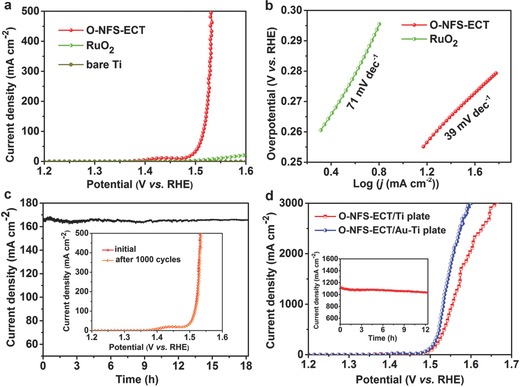
Figure 5.

a) LSV curves of O‐NFS‐ECT, RuO2 and bare Ti plate. b) Tafel plots of O‐NFS‐ECT and RuO2. c) Chronopotentiometric curve of O‐NFS‐ECT with a constant current density of 165 mA cm−2. Inset in c): LSV curves of initial O‐NFS‐ECT and after 1000 CV cycles. d) LSV curves of O‐NFS‐ECT deposited on pure Ti plate and Au‐coated Ti plate at high applied potentials. Inset in d): chronopotentiometric curve of O‐NFS‐ECT with a constant current density of 1100 mA cm−2.
