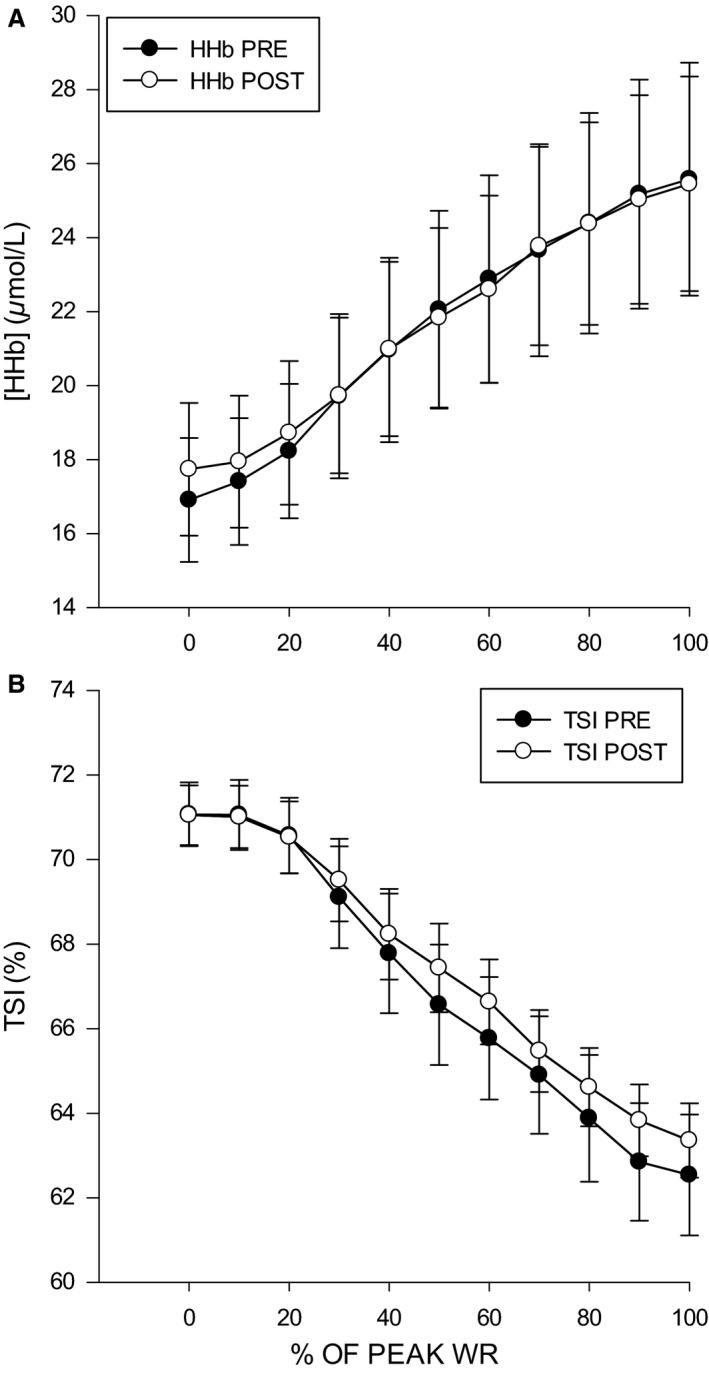
Figure 2.

Mean NIRS values of the right vastus lateralis. (A) Relative change in deoxyhemoglobin concentration [HHb] μmol L−1 pre‐ and 48 h post‐EIMD. (B) Relative change in tissue saturation index (TSI)% pre‐ and 48 h post‐EIMD. *denotes significance at P < 0.05.
