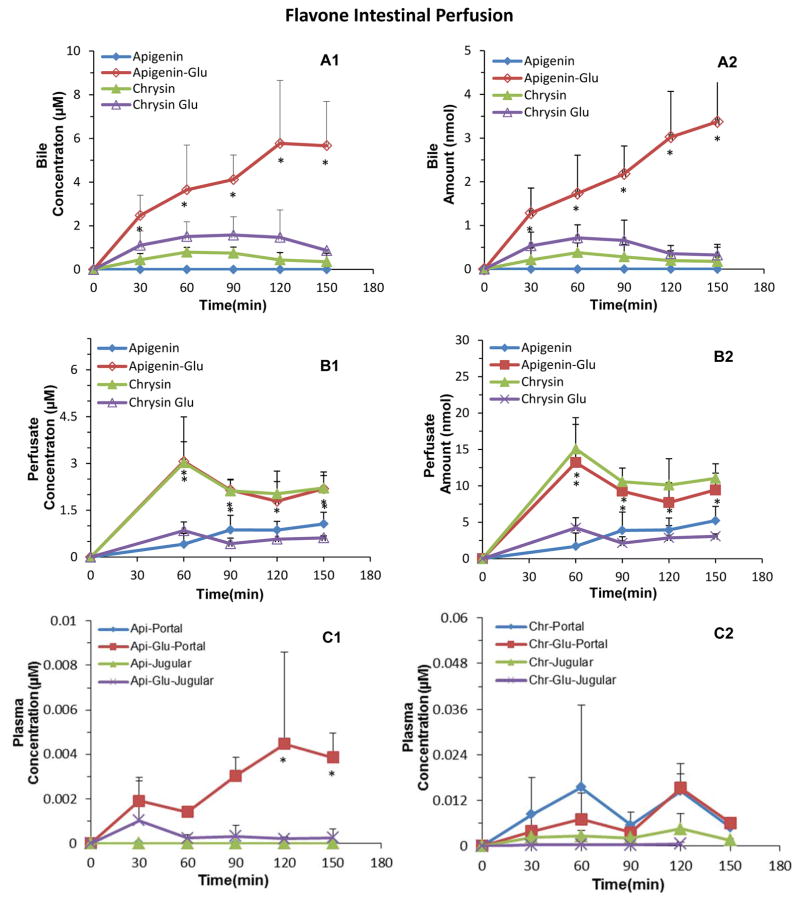
Figure 4.
Single-Pass Intestinal Perfusion Study of Flavones Apigenin and Chrysin. The concentration of individual flavone (perfused alone) was 10 μM delivered at a flow rate of 0.191 ml/min. We collected a perfusion, a bile, and a portal vein blood and a jugular vein blood sample every 30 min. Because bile is cannulated, it did not flow into the duodenum. Concentration of flavones and their glucuronide in bile (A1 Panel) and perfusate (B1 Panel) were determined using a LC or LC-MS/MS method. Amount of flavones and their conjugates in bile (A2 Panel) and perfusate (B2 Panel) were calculated after multiplying the concentration with the volume of the bile (usually 0.4–0.5 ml) or perfusate (usually around 5.4 ml) collected during the experiment. Plasma concentration of flavones and their glucuronides were also determined and shown in C1 and C2 panels. Each data point is the average of four determinations and the error bars are the standard deviation of the mean.

