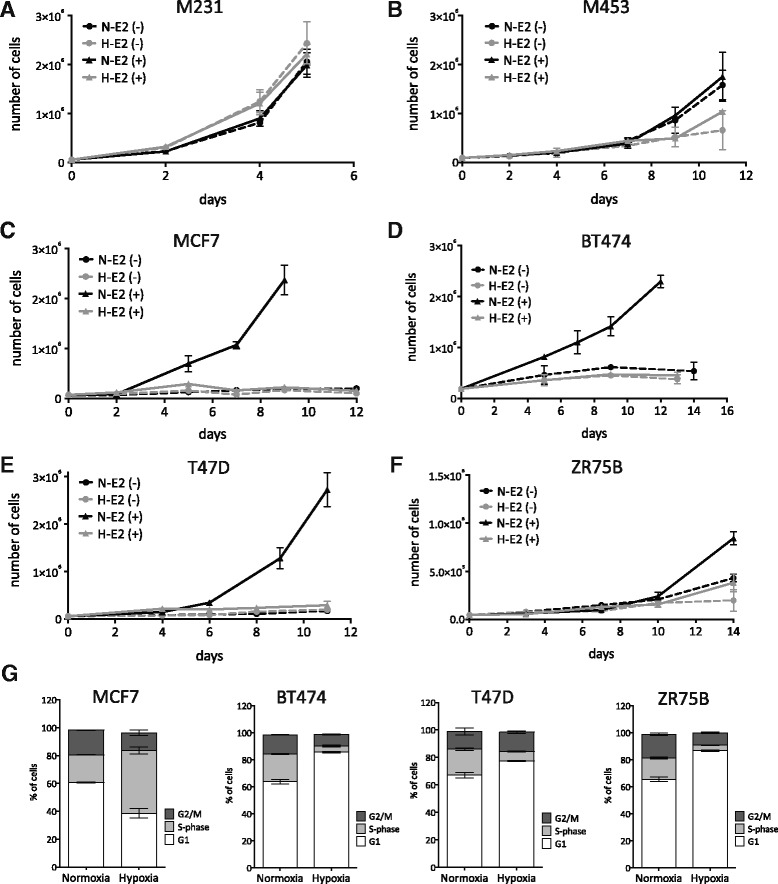
Fig. 5.

Hypoxic repression of ER activity inhibits proliferation. In vitro growth curves of cells grown with or without estradiol (E2) and at normoxia or hypoxia (1% O2). a MDA-MB-231, b MDA-MB-453, c MCF7, d BT474, e T47D and f ZR75B. Dashed lines are estrogen-free media, whereas solid lines contain 10 nM of estradiol. Black lines represent normoxic conditions, whereas gray lines are cells under hypoxic conditions. Two-way ANOVA analysis: a p > 0.05 MDA-MB-231, b p > 0.05 MDA-MB-453, c *p < 0.001 MCF7, d *p < 0.001 BT474, e *p < 0.001 T47D, f *p < 0.001 ZR75B. g Comparison of cell cycle distributions for cultures grown for 3 days at normoxia or hypoxia (1% O2). (T-student test *p < 0.001 MCF7, *p < 0.001 BT474, *p = 0.001 T47D, *p < 0.001 ZR75B). BT474 analysis was at a 6 day time point
