
Fig. 2.
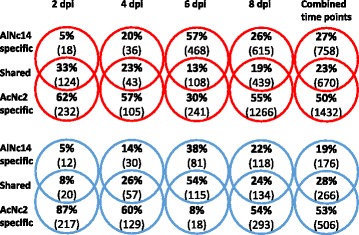
Genes differentially expressed in expression profiling experiment. The number of differentially expressed genes in MAGIC 107 Arabidopsis infected with AlNc14 or AcNc2 was calculated over an 8-day time course. The data are the average of four experiments. The Venn diagrams show the percentage of genes (with number of genes in brackets) that were up-regulated (red rings) or down-regulated (blue rings) at that time point and whether they were either unique to infection with one pathogen species, or were shared between the two pathogen species. Combined time points show genes that were up-regulated at one or more time points and not subsequently down-regulated (and vice versa)