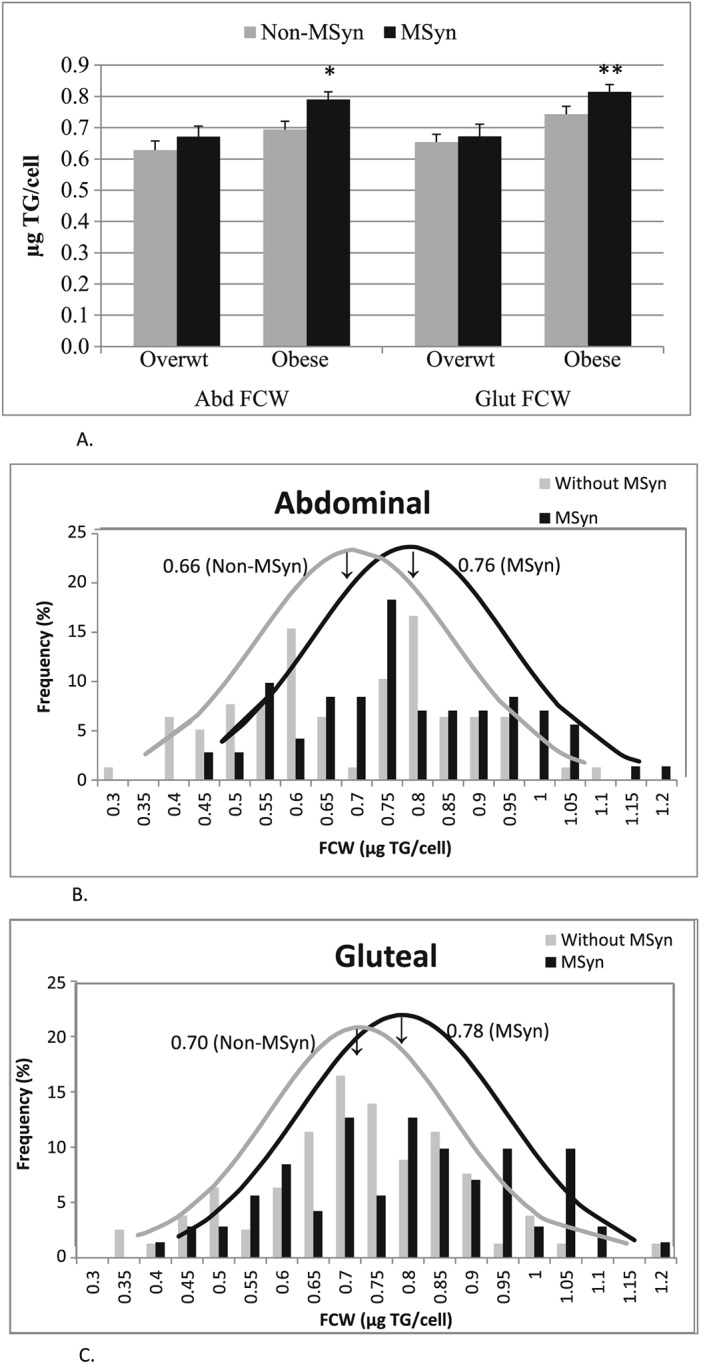
Figure 1.

A Bar graph shows mean ± SEM fat cell weights within overweight (Overwt) and obese groups by metabolic syndrome status. *P < 0.05; **P < 0.01: significantly different than obese non‐MSyn. Figure 1B and C. The distribution of mean fat cell weights (FCWs) in women with and without MSyn shows that despite comparable obesity, FCWs of women with MSyn are shifted to larger cells and have a larger mean FCW in both the ABD (Figure 1B) and GLT (Figure 1C) sites than in women without MSyn.
