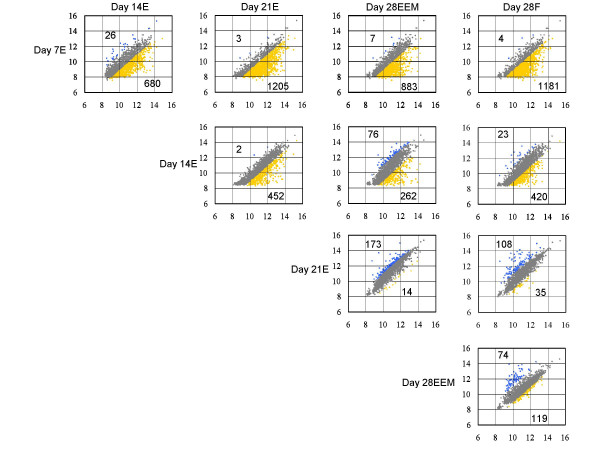
Figure 2.
Gene expression correlations of bovine peri-implantation embryo between Day 7E vs. Day 14E, Day 7E vs. Day 21E, Day 7E vs. Day 28EEM, Day 7E vs. Day 28F, Day 14E vs. Day 21E, Day 14E vs. Day 28EEM, Day 14E vs. Day 28F, Day 21E vs. Day 28EEM, Day 21E vs. Day 28F, and Day 28EEM vs. Day 28F. The yellow areas highlight a greater than two-fold gene expression difference (up-regulated) between the X-axis and Y-axis samples. The blue areas highlight a greater than two-fold gene expression difference (down-regulated) between the X-axis and Y-axis samples. The gray areas highlight a 0.5- to 2-fold gene expression difference between the X-axis and Y-axis samples.

