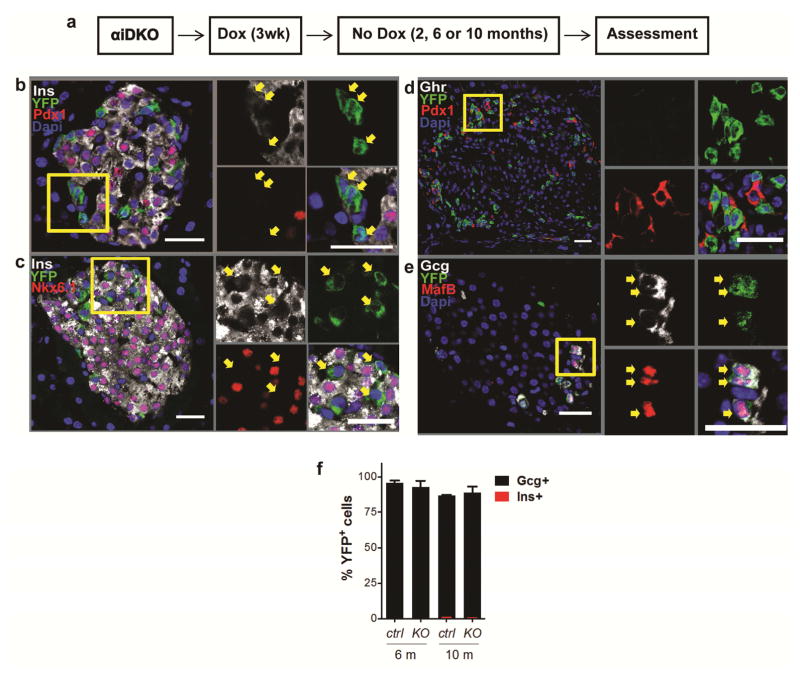
Figure 2. α-cells maintain their fate in the absence of Dnmt1.
(a) Schematic showing experimental design for Dox treatment of knock out and control animals.
(b–e) Immunostaining showing expression of α, β, δ, and ε-cell markers Gcg, MafB, Ins, Pdx1, Nkx6.1, Sst, and Ghrelin with YFP in αiDKO mice 10 months after Dox treatment. Yellow boxes show specific area of islet enlarged and represented by arrows on the right to demonstrate gene expression within specific cells or sets of cells. Scale bars represent 25 μm.
(f) Percentage of YFP+ cells that express glucagon or insulin in knockout and control mice. Bar graph data are represented as mean ± S.D. Dox, Doxycycline. N=4 mice per time point.

