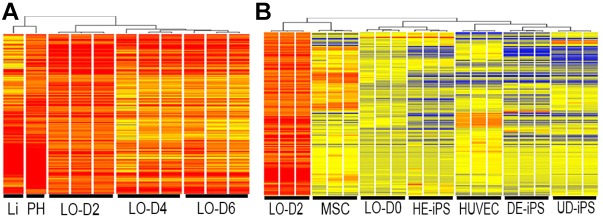
Fig. 2.
Liver organoid differentiation in vitro and in vivo. (A) Cluster analysis of gene expression profiles of liver organoids (n=3) at days 2, 4 and 6 of culture (LO-D2, LO-D4 and LO-D6, respectively). The expression profile of LO-D2 shows closest similarity with that of primary hepatocytes (PH) and liver tissue (Li). (B) Heatmap showing 442 genes (Tables S1 and S2) in the profile of LO-D2 that are shared with the PH and Li profiles (in A) and their expression in MSCs cultured alone, in HUVECs alone, in cell mixture at the time of plating of iPSCs+MSCs+HUVECs (liver organoid day 0, LO-D0), in hepatic-specified endoderm iPSCs (HE-iPS), in definitive endoderm iPSCs (DE-iPS) and in undifferentiated iPSCs (UD-iPS).

