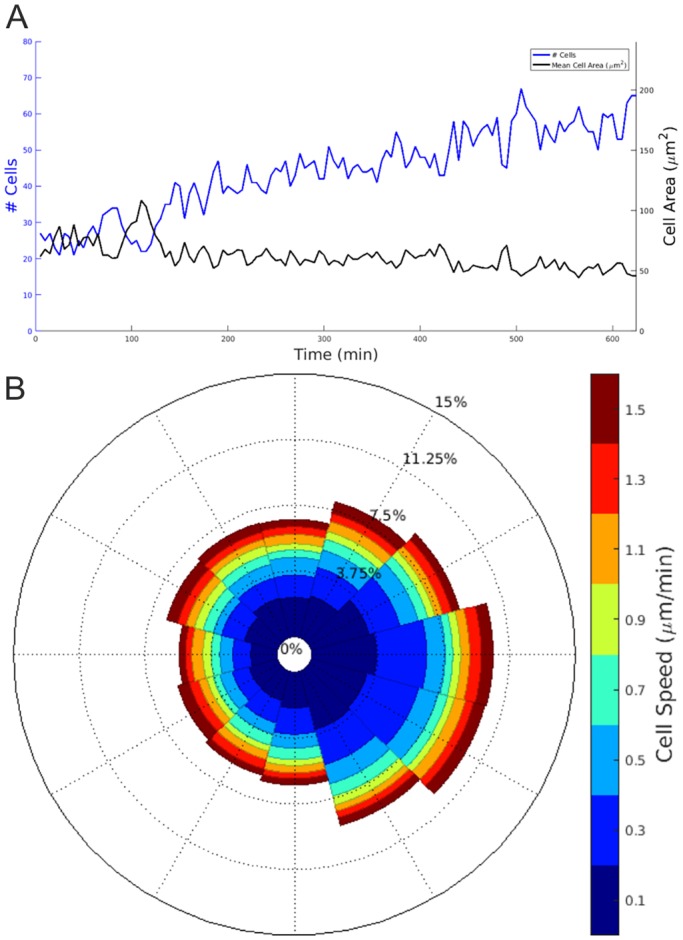
Fig. 4.

Segmented FiZD culture-based image data enable analysis of kidney morphogenetic parameters. (A) Increase in the number of UB tip cells in the right-hand side of the growing kidney (blue), and the mean cell area (black). (B) Wind rose plot illustrating the direction of UB tip cell migration. The lengths of the spokes of the wind rose plot indicate the proportions of cells moving in a given direction and the thicknesses of the colour bands within a spoke indicate their speed distribution. Both wind rose and cell count plots show that the kidney is growing towards the right, as the number of cells in the right half is increasing and more cells are moving towards the right. The data correspond to the single z-projection presented in Movie 3.
