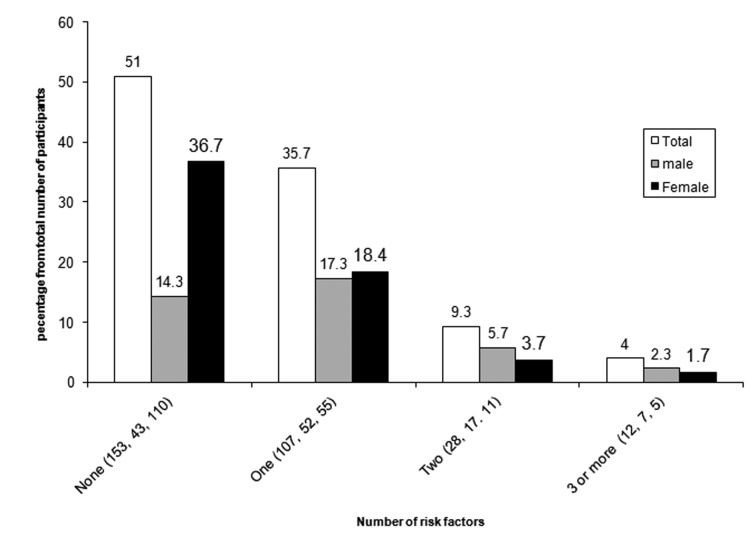
Figure 1.
Distribution of CV disease risk factors according to gender (P = 0.001). The numbers in brackets represent the number of participants having the specified figure of CV disease risk factors, while the value above the each column represent the percentage of participants having the particular number of CV disease risk factors.

