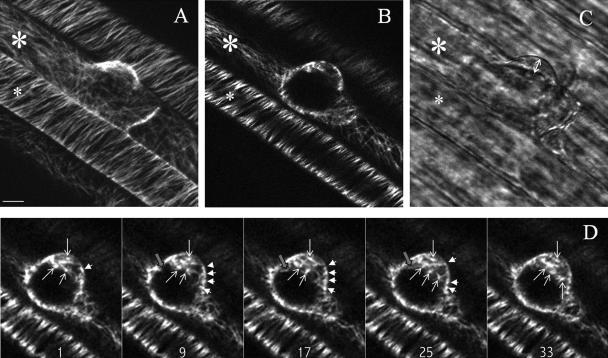
Figure 1.
MT organization during bulge formation visualized with GFP-MBD of MAP4 and imaged with a confocal laser scanning microscope by 3-D sampling (x, y, z; A–C) and repeated 2-D sampling (x, y, t; D). A, Maximal projection of 25 optical sections at 1-μm (z) intervals of MTs in a bulge. The small asterisk indicates an atrichoblast; the large asterisk indicates a trichoblast. B, Single optical section at the endoplasmic region in the middle of the outgrowing root hair. C, Transmission image; double arrow indicates the vesicle-rich region of the outgrowing root hair. D, Time sequence showing the dynamics of apparent initiation sites. Five representative single-optical sections are shown from a series of 40 images taken at 1-s intervals (Supplemental Movie 1). The numbers indicate the time in seconds. The pointed arrows indicate the endoplasmic-apparent initiation sites, the arrowheads indicate the cortical-apparent initiation sites, and the gray-blocked arrow shows the growth of a single MT. Scale bar = 10 μm.

