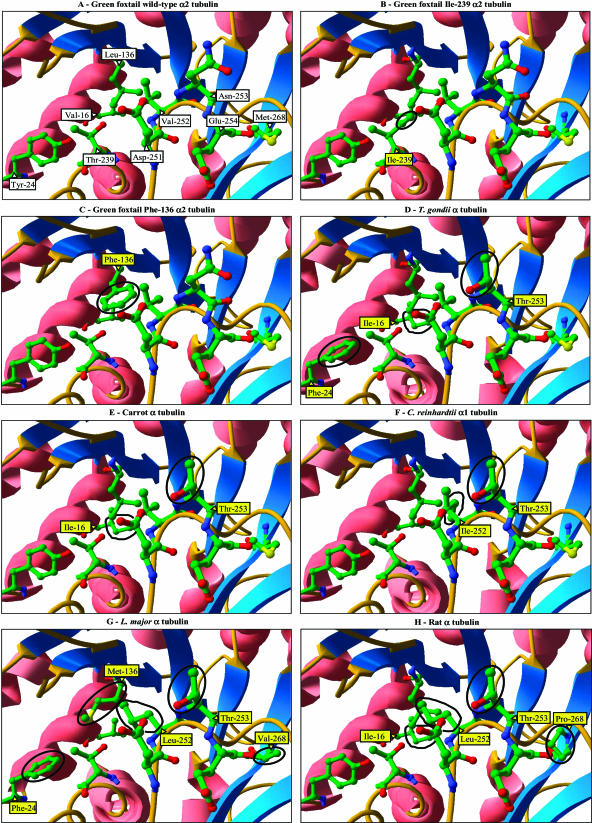
Figure 2.
Ribbon diagram view of the surface of the region involved in dimer-dimer tubulin contact in three-dimensional models for α-tubulins. Sequences used for modeling are wild type, Leu-136, Thr-239 foxtail α2-tubulin (A); mutant, Leu-136, Ile-239 foxtail α2-tubulin (B); mutant, Phe-136, Thr-239 foxtail α2-tubulin (C); T. gondii α-tubulin (GenBank/EMBL/DDBJ accession no. M20024; D); carrot α-tubulin (GenBank/EMBL/DDBJ accession no. AY007250; E); C. reinhardtii α1-tubulin (GenBank/EMBL/DDBJ accession no. M11447; F); L. major α-tubulin (GenBank/EMBL/DDBJ accession no. AL359683; G); and rat α-tubulin (GenBank/EMBL/DDBJ accession no. V01227; H). On the figure, α-helixes are pink, β-sheets are blue, and the areas with no particular structure are orange. Atom colors are green, C; red, O; blue, N; yellow, S. Side chains of residues not discussed in the text and hydrogen atoms are not shown for clarity. Amino acid positions are labeled at the base of the corresponding side chain. Amino acid positions containing side chains different from those in wild type, Leu-136, Thr-239 foxtail α2-tubulin are in yellow boxes, and the resulting structural differences are circled.

