Figure 6.
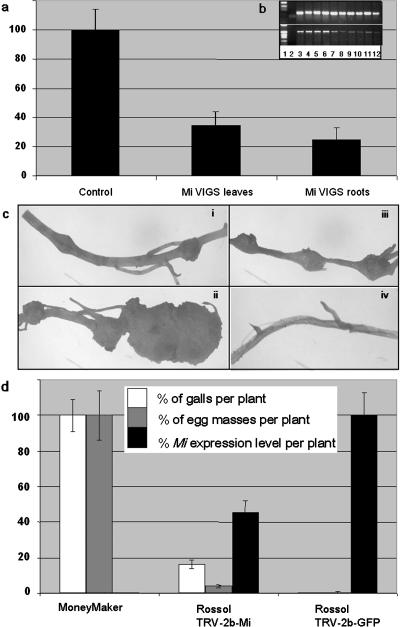
VIGS of the Mi gene in tomato. a, Molecular characterization of Mi silencing in tomato leaves and roots. Real-time RT-PCR determination of normalized relative amounts of Mi mRNA levels in silenced and control roots or leaves of tomato plants challenged with TRV-2b-Mi or TRV-2b-GFP constructs (21 dpi). Values are expressed in percentage of normalized Mi mRNA-related TRV-2b-GFP control in a given tissue. Values represent the means of at least three to six different plants per construct ± se. b, Semiquantitative RT-PCR of leaves and roots of Mi-silenced and control tomato plants challenged with, respectively, TRV-2b-Mi or TRV-2b-GFP constructs (21 dpi; same set of samples used for real-time RT-PCR). Both RT-PCR products corresponding to Mi and PDS mRNA have been assessed. Presented here are PCR conditions corresponding to the log-linear phase of amplified PCR product in nonsilenced tissues. Lane 1 is 1-kb molecular mass marker; lane 2 is nontemplate control; lanes 3 to 4 and 5 to 6 are leaf root tissues from two independent control plants challenged with TRV-2b-GFP; lanes 7 to 8, 9 to 10, and 11 to 12 are leaf root tissues from three independent silenced plants challenged with TRV-2b-Mi. Top, PDS PCR product; bottom, Mi PCR product. c, Mi resistance-breaking phenotype in Rossol silenced roots. Upon nematode infection, roots of susceptible Money Maker plants display both small (subsection i) and large galls with abundant egg masses (subsection ii). Small galls were observed on Mi-silenced Rossol plants (subsection iii). No galls were observed in all control unsilenced Rossol plants infected with TRV-2b-GFP (subsection iv). d, Molecular characterization of Mi silencing in tomato roots and effect on nematode infection. Real-time RT-PCR determination of normalized relative amounts of Mi mRNA levels in silenced (n = 6) and control (n = 3) roots of tomato plants challenged with TRV-2b-Mi or TRV-2b-GFP constructs (49 to 56 dpi). Values are expressed in percentage of normalized Mi mRNA related to TRV-2b-GFP control plants (black). The averaged percentage of galls (white) and egg masses (gray) per plant from two independent experiments (Table I) is presented. Values represent the means of different plants per construct ± se (n ranging from 7–18). RNA was extracted from root segments of 2- to 3-cm lengths spanning the galls on TRV-2b-Mi roots.

