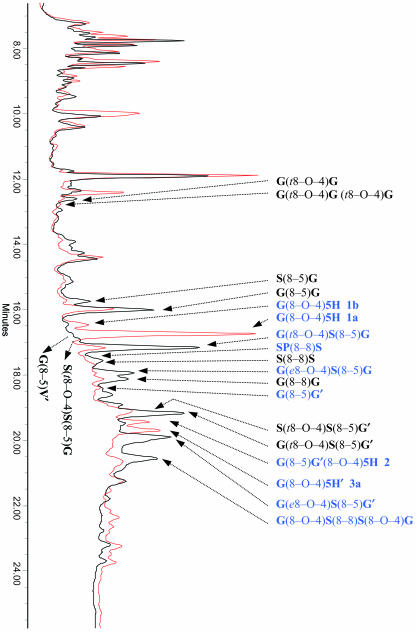
Figure 2.
HPLC analysis. Overlay of the HPLC chromatograms of the xylem extract of a wild-type (black) and a COMT down-regulated line (ASB 2B, red), showing the position of the different oligolignols. Oligolignols that are significantly different in abundance between wild-type and COMT-deficient poplars are in blue.

