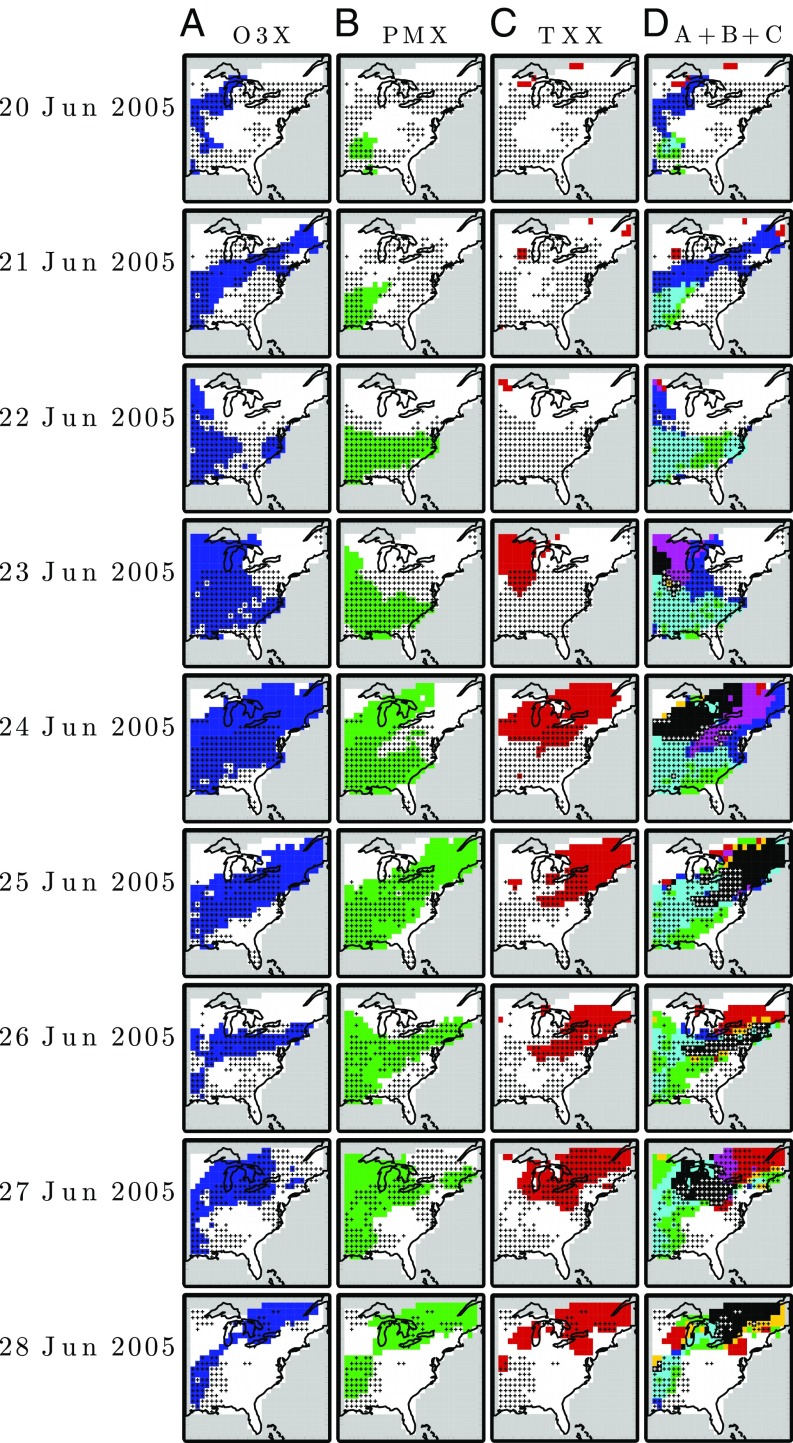
Fig. 2.
Nine-day (June 20–28, 2005) episode progression for O3X (blue) (A), PMX (green) (B), TXX (red) (C), and their combinations (D). Colors in D correspond to the combined individual RGB triplets, i.e., O3X+PMX (cyan), O3X+TXX (magenta), PMX+TXX (yellow), and O3X+PMX+TXX (black). Stippling denotes an identified stagnation day (white stipples in D if the grid cell has all three extreme types).

