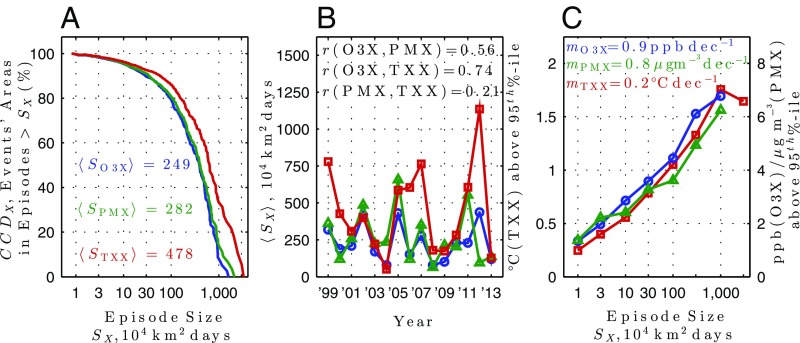
Fig. 5.
Episode sizes and enhancements. (A) CCD (%) of the total areal extent of extreme events as a function of episode size S (104 km2 days) for O3X (blue), PMX (green), and TXX (red) episodes. Average episode sizes 〈S〉 over the 15-y period are provided in the inset. (B) Annual derived average episode size 〈S〉 for each extreme type and paired correlation coefficients (r). (C) Average value of the extreme events (ppb for O3X, µg m−3 for PMX, °C for TXX) relative to the 95th percentile as a function of episode size. Also shown is the slope of the enhancement per log-decade in S.

