Fig. 2.
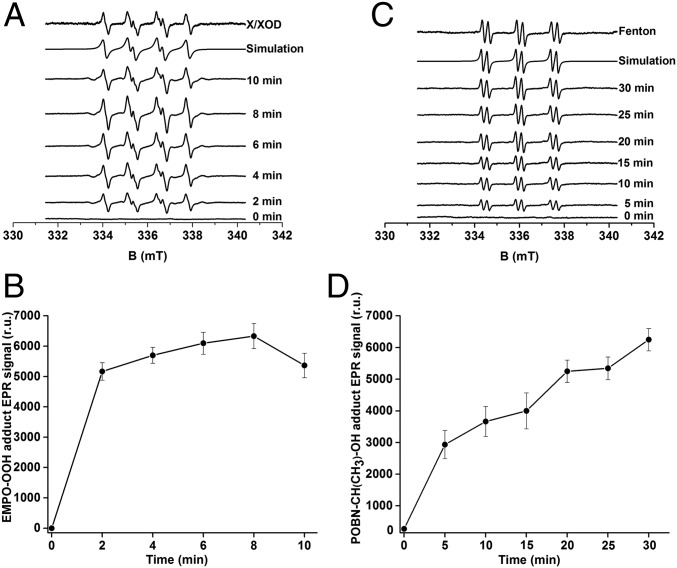
EPR spectroscopy of light-induced EMPO-OOH and POBN-CH(CH3)OH adducts in PSII membranes. (A) EMPO-OOH adduct EPR spectra were obtained after illumination of PSII membranes in the presence of 50 mM EMPO and 40 mM Mes (pH 6.5). Control EMPO-OOH adduct EPR spectrum using the xanthine/xanthine oxidase system and its simulation are shown above. Spectrum obtained at various illumination times are shown below. (B) The time profile of the light-induced EMPO-OOH adduct EPR signal. (C) POBN-CH(CH3)-OH adduct EPR spectra were obtained after illumination of PSII membranes in the presence of 50 mM POBN, 170 mM ethanol, and 40 mM Mes-NaOH (pH 6.5). Control POBN-OH EPR spectrum obtained using Fenton reagents (200 μM H2O2 and 40 μM FeSO4) and its simulation are shown above. Spectrum obtained at various illumination times are shown below. (D) The time profile of the light-induced POBN-CH(CH3)OH adduct EPR signal. In B and D, each point represents the mean value and the SD of at least three experiments with respective units of EPR spectra (mean ± SD, n = 3).

