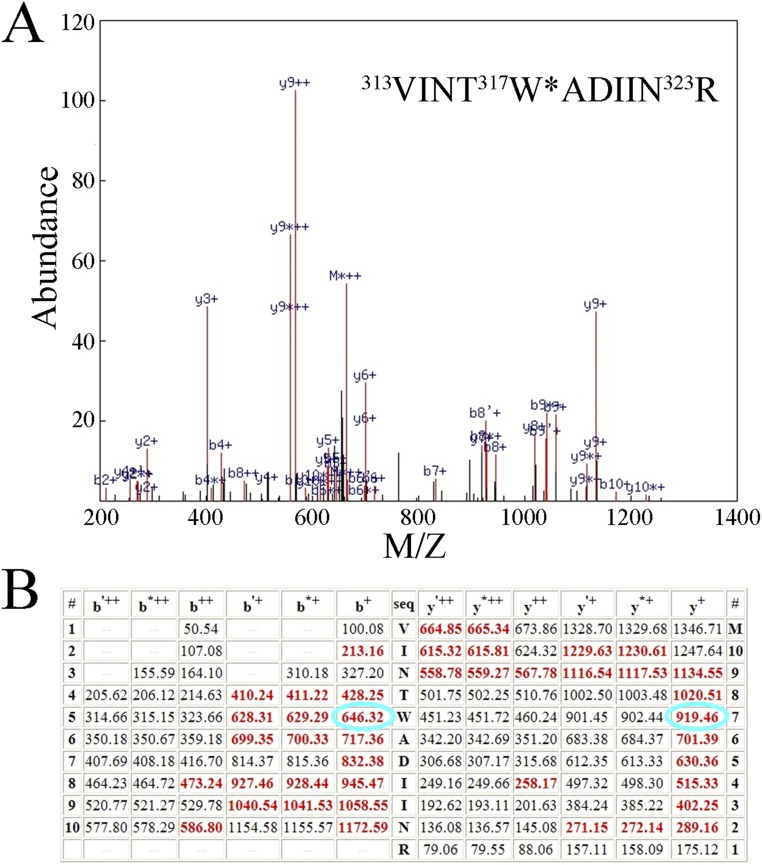
Fig. S3.
Quality of the mass spectrometry. Shown are the mass spectrometry data obtained for the lowest quality peptide (highest P value) used in this study (D1:313V-323R, P = 6.3 × 10⁻⁶). (A) Mass spectrum obtained for this peptide. Identified ions are shown in red, those not identified in black. The sequence of the modified peptide is shown above; the modified tryptophanyl residue (317W) is marked with an asterisk and bears a double oxidation (+31.9898 Da). (B) Table of predicted ions from this peptide. Identified ions are shown in red; those not identified in black. The b+ and y+ ions for the doubly oxidized D1:317W are circled in cyan. Note the nearly complete y- and b-ion series obtained.

