Fig. 5.
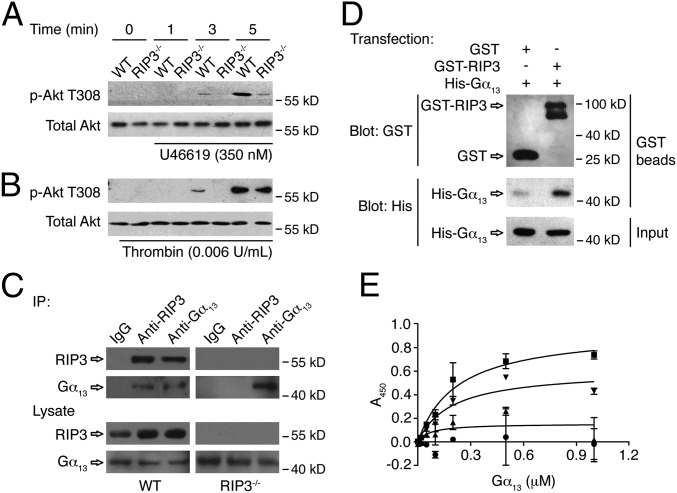
The role of RIP3 in Akt phosphorylation, and the interaction of RIP3 with Gα13. (A and B) Washed platelets were stimulated with 350 nM U46619 (A) or 0.006 U/mL thrombin (B) for indicated times at 37 °C, with stirring (1,000 rpm). Stimulated platelets were lysed and samples analyzed by Western blot with anti–phospho-Akt (Thr308) and anti-total Akt antibodies. (C) Washed mouse platelets were lysed and immunoprecipitated with anti-mouse RIP3 and Gα13 antibodies or IgG controls. After incubation with protein A/G plus agarose beads, the proteins were analyzed by Western blot with anti-RIP3 and anti-Gα13 antibodies. (D) The pcDNA3.1(+)- expressing GST or GST-RIP3 and the pcDNA3.1(+)-expressing His-Gα13 were cotransfected into HEK293T cells. The cells were cultured, harvested, and lysed. The lysates were centrifuged, after which the supernatants were mixed with glutathione beads and incubated at 4 °C overnight. The beads were washed, and the bead-bound proteins were analyzed by immunoblotting. The Western blot shown is representative of three independent experiments. (E) Purified proteins and BSA (4 μg/mL) were immobilized onto the wells of microtiter plates. Increasing concentrations of His-tagged human Gα13 protein were incubated with immobilized GST (●), GST-RIP3 (■), GST-RIP3-N (▲), GST-RIP3-C (▼), and BSA. The binding of Gα13 was detected by mouse anti-His antibody and HRP-conjugated goat anti-mouse antibody. The absorbance at 450 nm was measured in three independent experiments. Data are presented as mean ± SD after subtracting the binding of Gα13 to BSA (negative control). The binding curve was fitted to the following equation: Y = Bmax × x/(Kd + x), where Y is the specific binding, x is the ligand concentration, Bmax is the binding maximum, and Kd is the equilibrium dissociation constant. For some data points, the error bars are smaller than the symbols.

