Fig. 3.
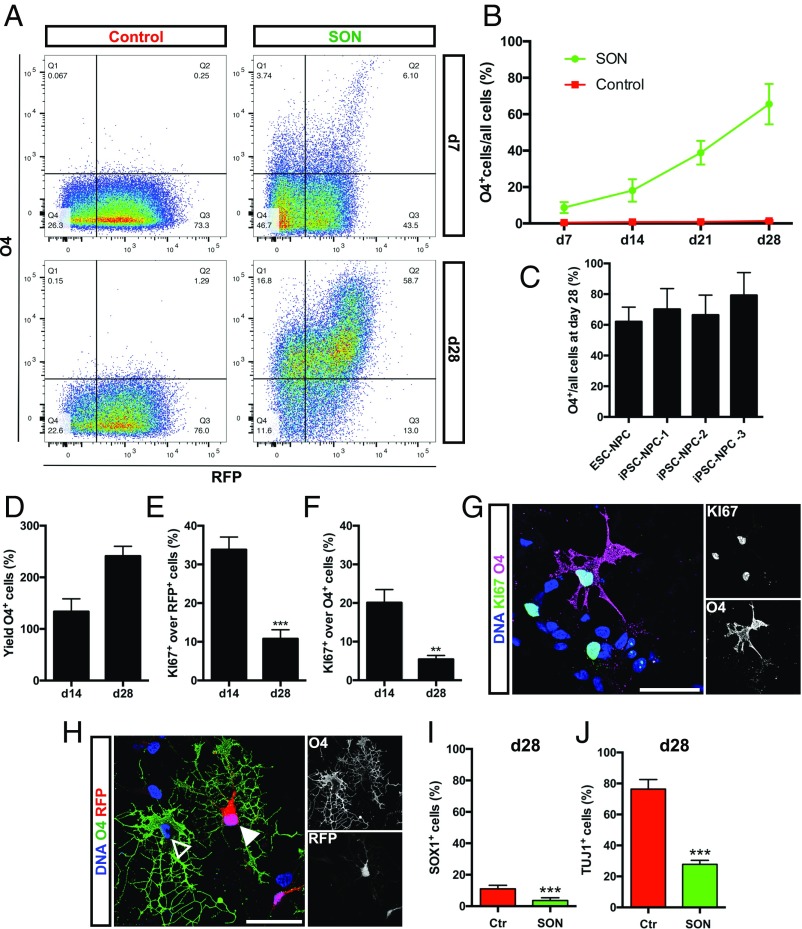
Quantification of oligodendroglial lineage cells after SON induction. (A) Representative flow cytometry analyses for the expression of O4 and RFP in control and SON cultures 7 and 28 d after transgene induction. (B) Quantification of O4+ cells in control and SON cultures 1 to 4r wk after transgene induction. Data are presented as mean of replicates from four independent experiments, each using NPC derived from an independent human PSC line + SD. (C) Quantification of O4+ iOL at day 28 derived from one human ESC and three independent iPSC lines. Data are presented as mean of replicates from three to five independent differentiation experiments per cell line + SD. (D) Quantification of O4+ iOL yields at days 14 and 28 after transduction. Data are presented as mean of replicates from three independent differentiation experiments, each using an independent iPSC-derived NPC line + SD. (E) Quantification of Ki-67+ transgene-expressing cells (RFP) and of (F) Ki-67+/O4+ iOL at days 14 and 28 after induction. Data are presented as mean of replicates from three independent differentiation experiments + SD (**P < 0.01, ***P < 0.001). (G) Immunostaining of iOL for O4 (purple) and the proliferation marker Ki-67 (green) at day 14 after transduction. (H) Representative immunofluorescence image of O4+ iOL (green) 28 d after transduction either expressing (filled arrowhead) or silencing (empty arrowhead) the transgenes. (Scale bars, 40 μm.) (I) Quantification of SOX1+ iPSC-derived NPC and (J) TUJ1+ neurons in control and SON cultures at day 28. Data are presented as mean of replicates from three independent differentiation experiments + SD. Student’s t test was performed for statistical analysis (***P < 0.001).

