Fig. 8.
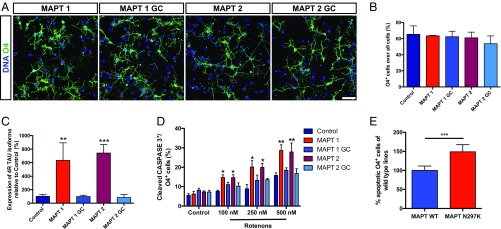
MAPT-OL exhibit mutation related phenotypes. (A) Immunostaining for O4 (green) demonstrating differentiation of iPSC carrying the N279K MAPT mutation (MAPT1, MAPT2) and genetic corrected controls (MAPT1 GC, MAPT2 GC) into iOL. Nuclei were counterstained with Hoechst (blue). (Scale bar, 25 µm.) (B) Flow cytometry-based quantification of O4+ iOL after 28 d of differentiation in MAPT mutation cultures, genetic corrected cultures, and an independent healthy control culture. Data are presented as mean of replicates from three independent experiments + SD. (C) Quantitative RT-PCR analysis on control, MAPT gene-corrected, and MAPT mutated iOL cultures for 4R tau isoforms containing exon 10. Expression levels were normalized to total tau expression and control lines. Data are presented as mean of replicates from three independent experiments + SD. One-way ANOVA with post hoc Tukey test was performed for statistical analyses (**P < 0.01, ***P < 0.001). (D) Quantification of cleaved CASPASE 3+ iOL in control and MAPT cultures after 48 h of either vehicle [0.01% (vol/vol) DMSO] or rotenone treatment. Data are presented as mean of replicates from three independent experiments + SD. One-way ANOVA with post hoc Tukey test was performed for statistical analysis (*P < 0.05, **P < 0.01). (E) All results combined after normalization by setting all control cultures to 100%, show that MAPT N279K causes a higher sensitivity to oxidative stress. Error bars present SD. Student’s t test was performed for statistical analysis (***P < 0.001).

