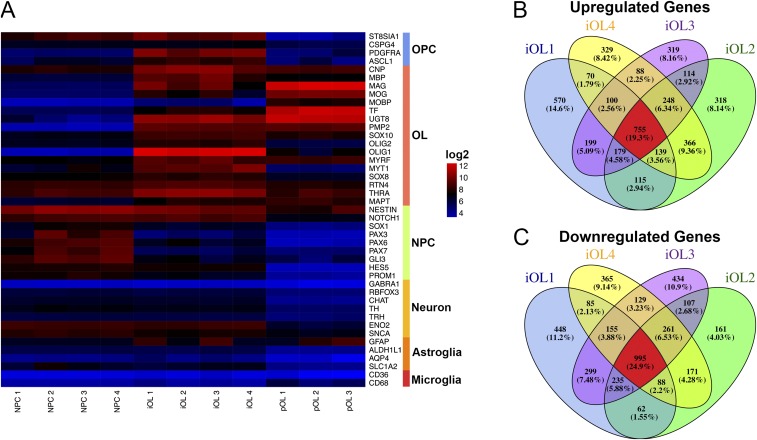
Fig. S6.
Global transcriptional profiling of iOL. (A) Heatmap illustrating gene expression for cell-type–enriched genes comparing iPSC-derived NPC, iOL and pOL. Each biological replicate of NPC and iOL presents the mean of two to three independent experiments. (B and C) Venn diagram showing the overlap of genes significantly up-regulated (B) or down-regulated (C) in four biological independent iOL cell lines compared with their corresponding iPSC-derived NPC population. Each iOL cell line presents the mean of replicates from two to three independent experiments.

