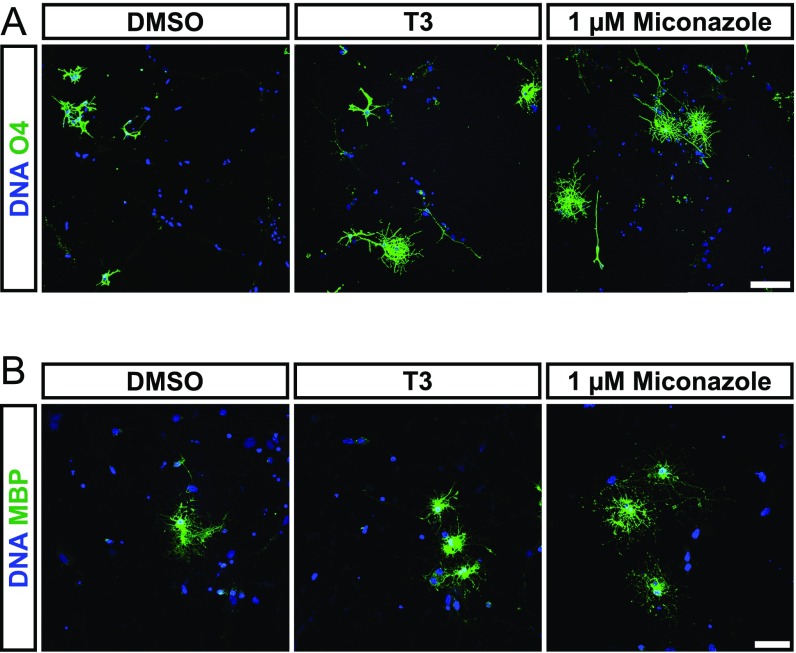
Fig. S13.
ICC analysis of iOL in DM containing selected compounds. (A and B) Representative immunofluorescence images of iOL cultures treated with either vehicle [0.01% (vol/vol) DMSO], T3 as a positive control, or 1 µM of the drug candidate miconazole for 21 d in minimum DM. Oligodendroglial lineage commitment was assessed by (A) O4 (green) and (B) MBP (green) immunostaining; nuclei were counterstained with Hoechst (blue). (Scale bars, 50 µm.)

