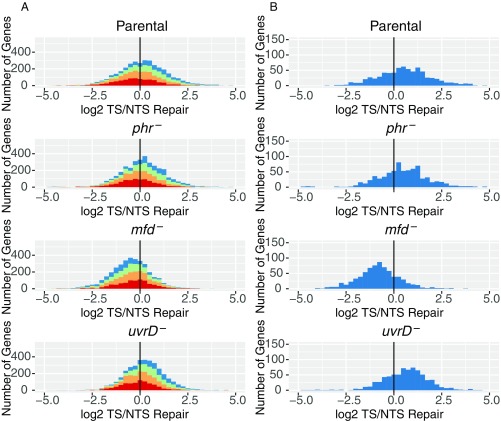
Fig. 4.
Frequency distribution of Log2-transformed TS/NTS repair in all annotated genes. (A) E. coli genes in four different strains colored by sense strand transcription levels going from lowest quartile RNA-seq count colored in red, to orange, to green, to the highest transcription quartile, in blue. Theoretically, the more weakly transcribed genes are more likely to exhibit repair profiles strongly influenced by antisense transcription and by repair hotspots. The means for each sample are 1.16 (Parental), 1.14 (phr−), 0.68 (mfd−), and 1.17 (uvrD−), and all of them are different from 0 based on one sample t test with P values <0.01. In Exp. 2, means for each sample were 1.09, 1.14, 0.68, and 1.04. (B) Top 25% most transcribed genes are plotted. Means for parental, phr, mfd, and uvrD cells are 1.41, 1.46, 0.53, and 1.61 for Exp. 1 (plotted) and 1.41, 1.46, 0.54, and 1.21 in Exp. 2, respectively. The vertical black line represents the border where TS repair level is equal to NTS repair.

