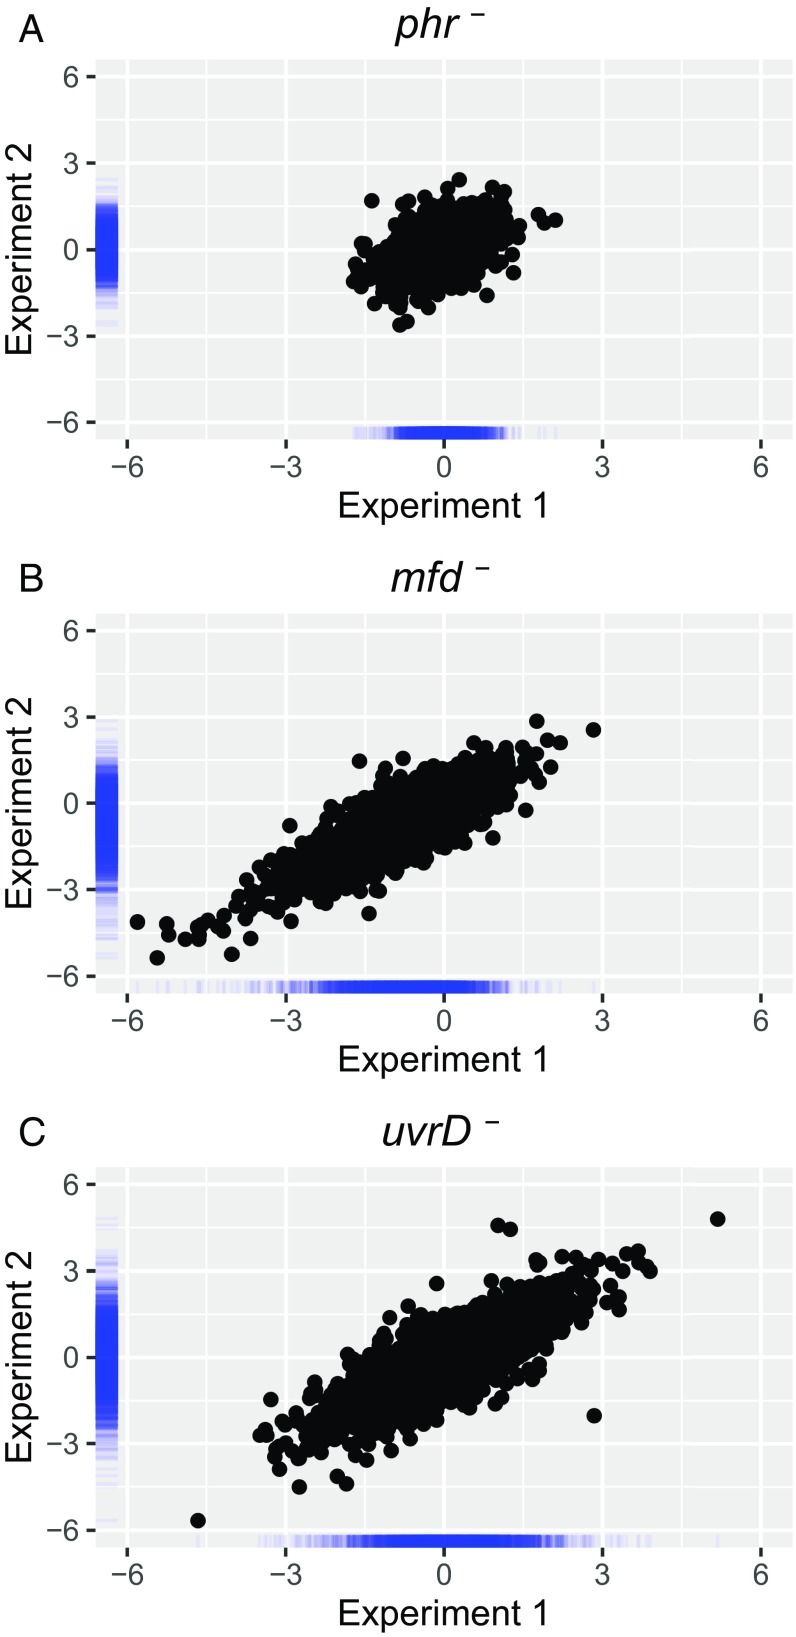
Fig. S1.
Reproducibility of the mutation effect on TCR (A) phr–, (B) mfd–, and (C) uvrD–. The x and y axes represent Exp. 1 and Exp. 2, respectively. Axis values are the log2-transformed ratio of mutant/Parental TS/NTS values. Pearson correlation coefficients are 0.43 (phr–), 0.85 (mfd–), and 0.81 (uvrD–). Blue bars along the axes represent density distribution of data points.

