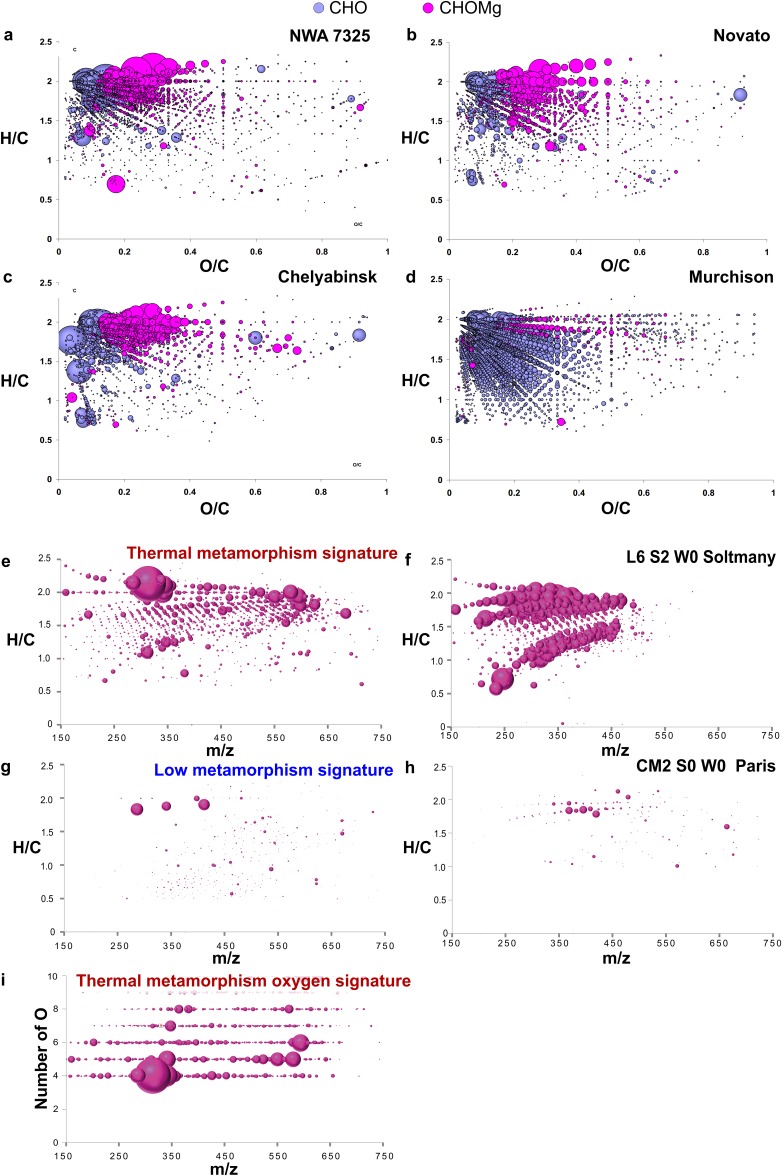
Fig. S6.
Van Krevelen diagrams for the comparison of CHO and CHOMg compositions for several meteorites and modified van Krevelen diagrams representing the thermal metamorphism signature. Van Krevelen representations of soluble organic matter in NWA 7325 (A), Novato (B), Chelyabinsk (C), and Murchison (D) are shown. It is obvious that the less-altered CM2 chondrite Murchison is poor in CHOMg compositions, compared with the ungrouped achondrite NWA 7325 and the ordinary chondrites, Novato and Chelyabinsk. Modified van Krevelen diagrams of the overlapped CHOMg molecules (50th percentile of positive loading values on the x axis) reflect the highly aliphatic structure of the CHOMg compositional space (A) for relevant loadings, which represent high (E) and low (G) thermal metamorphism signatures seen in the 61 meteorites studied. These plotted m/z values reflect the 50th percentile of the variables, which are unique for the positive (E) and negative (G) values of the first component (x axis) of the OPLS score plot (Fig. 5). These compounds in E may represent thermal metamorphism markers. The bubble size represents the relative intensity of the mass peaks. (F and H) Mass-edited H/C ratios of two representative examples for low- (Paris) and high-degree thermally processed meteorites (Soltmany) (35). Paris is known to be one of the least-altered meteorites (36). The convergence of O = 4 in CHOMg molecular formulas for thermal stress loading values is presented by an oxygen number-m/z diagram. (I) Again, these plotted m/z values reflect the 50th percentile of the variables, which are unique for the positive values of the first component (x axis) of the OPLS score plot (Fig. 5).

