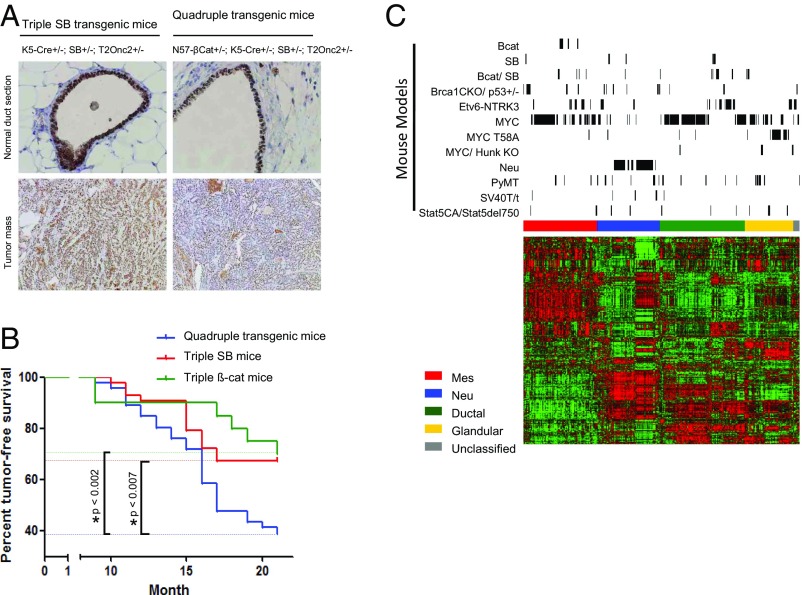
Fig. 1.
SB mutagenesis drives mammary tumorigenesis in the mouse. (A) SB was activated in both the luminal and basal cell layers of the mouse mammary gland. (B) Tumor incidence rates among three different groups of mice across time. (C) Heatmap of mouse mammary tumor subtypes and mRNA expression for our genes of interest across mouse (green indicates low expression; red indicates high expression). Genes and samples are represented along the rows and columns, respectively. Mouse tumors and genes are aligned based on consensus clustering results. The positions of mouse mammary tumors from different mouse models are indicated by the black bars on top. The color bar on top of the heatmap indicates the subtypes of mouse mammary tumors: red, mesenchymal (Mes); blue, HER2/Neu; green, ductal; yellow, glandular; gray, unclassified). Bcat, β-catenin; mmT, mouse mammary tumor.

