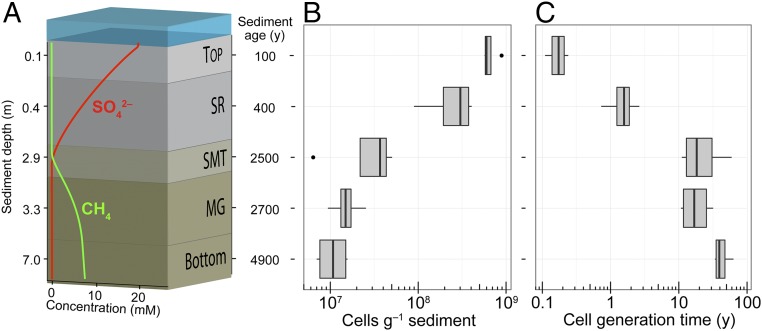
Fig. 1.
Vertical biogeochemical zonation and distribution of microbial biomass and turnover in Aarhus Bay sediments. (A) Biogeochemical zonation. Top, surface sediment; SR, upper sulfate-rich sediment; SMT, sulfate–methane transition zone; MG, methanogenic sediment; Bottom, deep methanogenic zone. Pore water concentrations of sulfate and methane and sediment depth and age relate to Station M29A (SI Appendix, Table S1). Sediment depth and age axes are not drawn to scale. (B) Microbial cell abundances determined by qPCR quantification of 16S rRNA genes in extracted DNA assuming that bacterial and archaeal cells on average harbor 4.1 and 1.6 gene copies, respectively. (C) Average generation time for cells as estimated from cell-specific rates of carbon oxidation, cellular carbon content, and growth yield (Materials and Methods). In the box-and-whisker plots, the middle line represents the median value for four different sampling stations and horizontal lines represent minimum and maximum values. The box stretches from the lower to the upper quartile and dots show outliers (>1.5 times the corresponding quartile).

