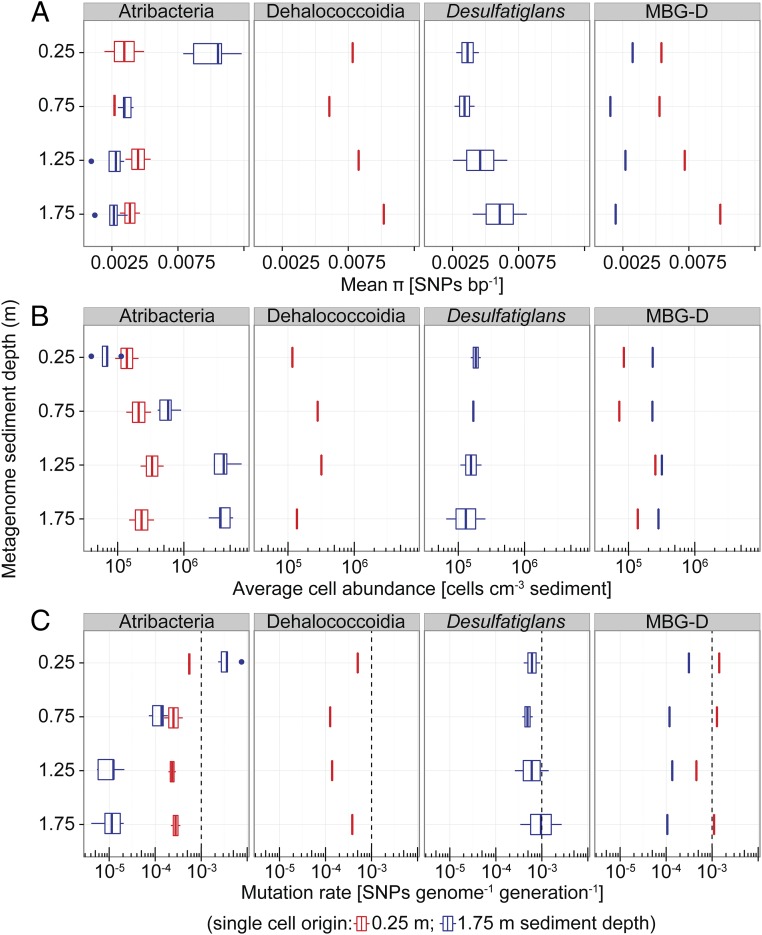
Fig. 3.
Genetic diversity and rates of evolution within subsurface microbial populations. (A) Genome nucleotide diversity (π) as measured by mapping metagenome reads onto genomes of single cells derived from 0.25 m or 1.75 m sediment depth and quantifying the number of SNPs. Taxonomic names indicate the identities of the single-cell genomes (Atribacteria, n = 7; Dehalococcoidia, n = 1; Desulfatiglans, n = 2; MBG-D, n = 2; SI Appendix, Table S3). (B) Abundance of the populations represented by the single cells as inferred by multiplying the fraction of reads within a metagenomic library that mapped to the SAGs by microscopic total cell counts from the respective sediment depths. (C) Mutation rates (µg) calculated according to µg = π/2Ne, assuming that effective population size (Ne) equals the total population size shown in B and using π and the estimated genome sizes to infer SNPs genome−1 (Materials and Methods). The dashed lines show, for comparison, the µg of growing E. coli cultures. Box-and-whisker plots are as defined in Fig. 1.

